April 11, 2025
Inside the Bear: Breaking Down Market Declines
Tom O'Shea, CFA
Director of Investment Strategy
Innovator Capital Management
Following April 2nd's liberation day, the S&P 500 experienced its largest two-day decline since the COVID-19 panic. Investors appeared to underprice the risks of economic damage from global tariffs imposed by the Trump administration in the time leading up to liberation day. With its 18.8% max drawdown¹, the S&P 500 was knocking on the door of another bear market, the first since the tightening cycle of 2022. Then right before our eyes, President Trump pulled an uno reverse card and paused tariffs beyond 10% (except for China) for a 90-day period, sending the S&P 500 9.5% higher in a single day! While markets didn't technically reach bear market territory, I figured we were close enough to evaluate prior corrections near 20% to give investors an idea of the possibilities ahead.
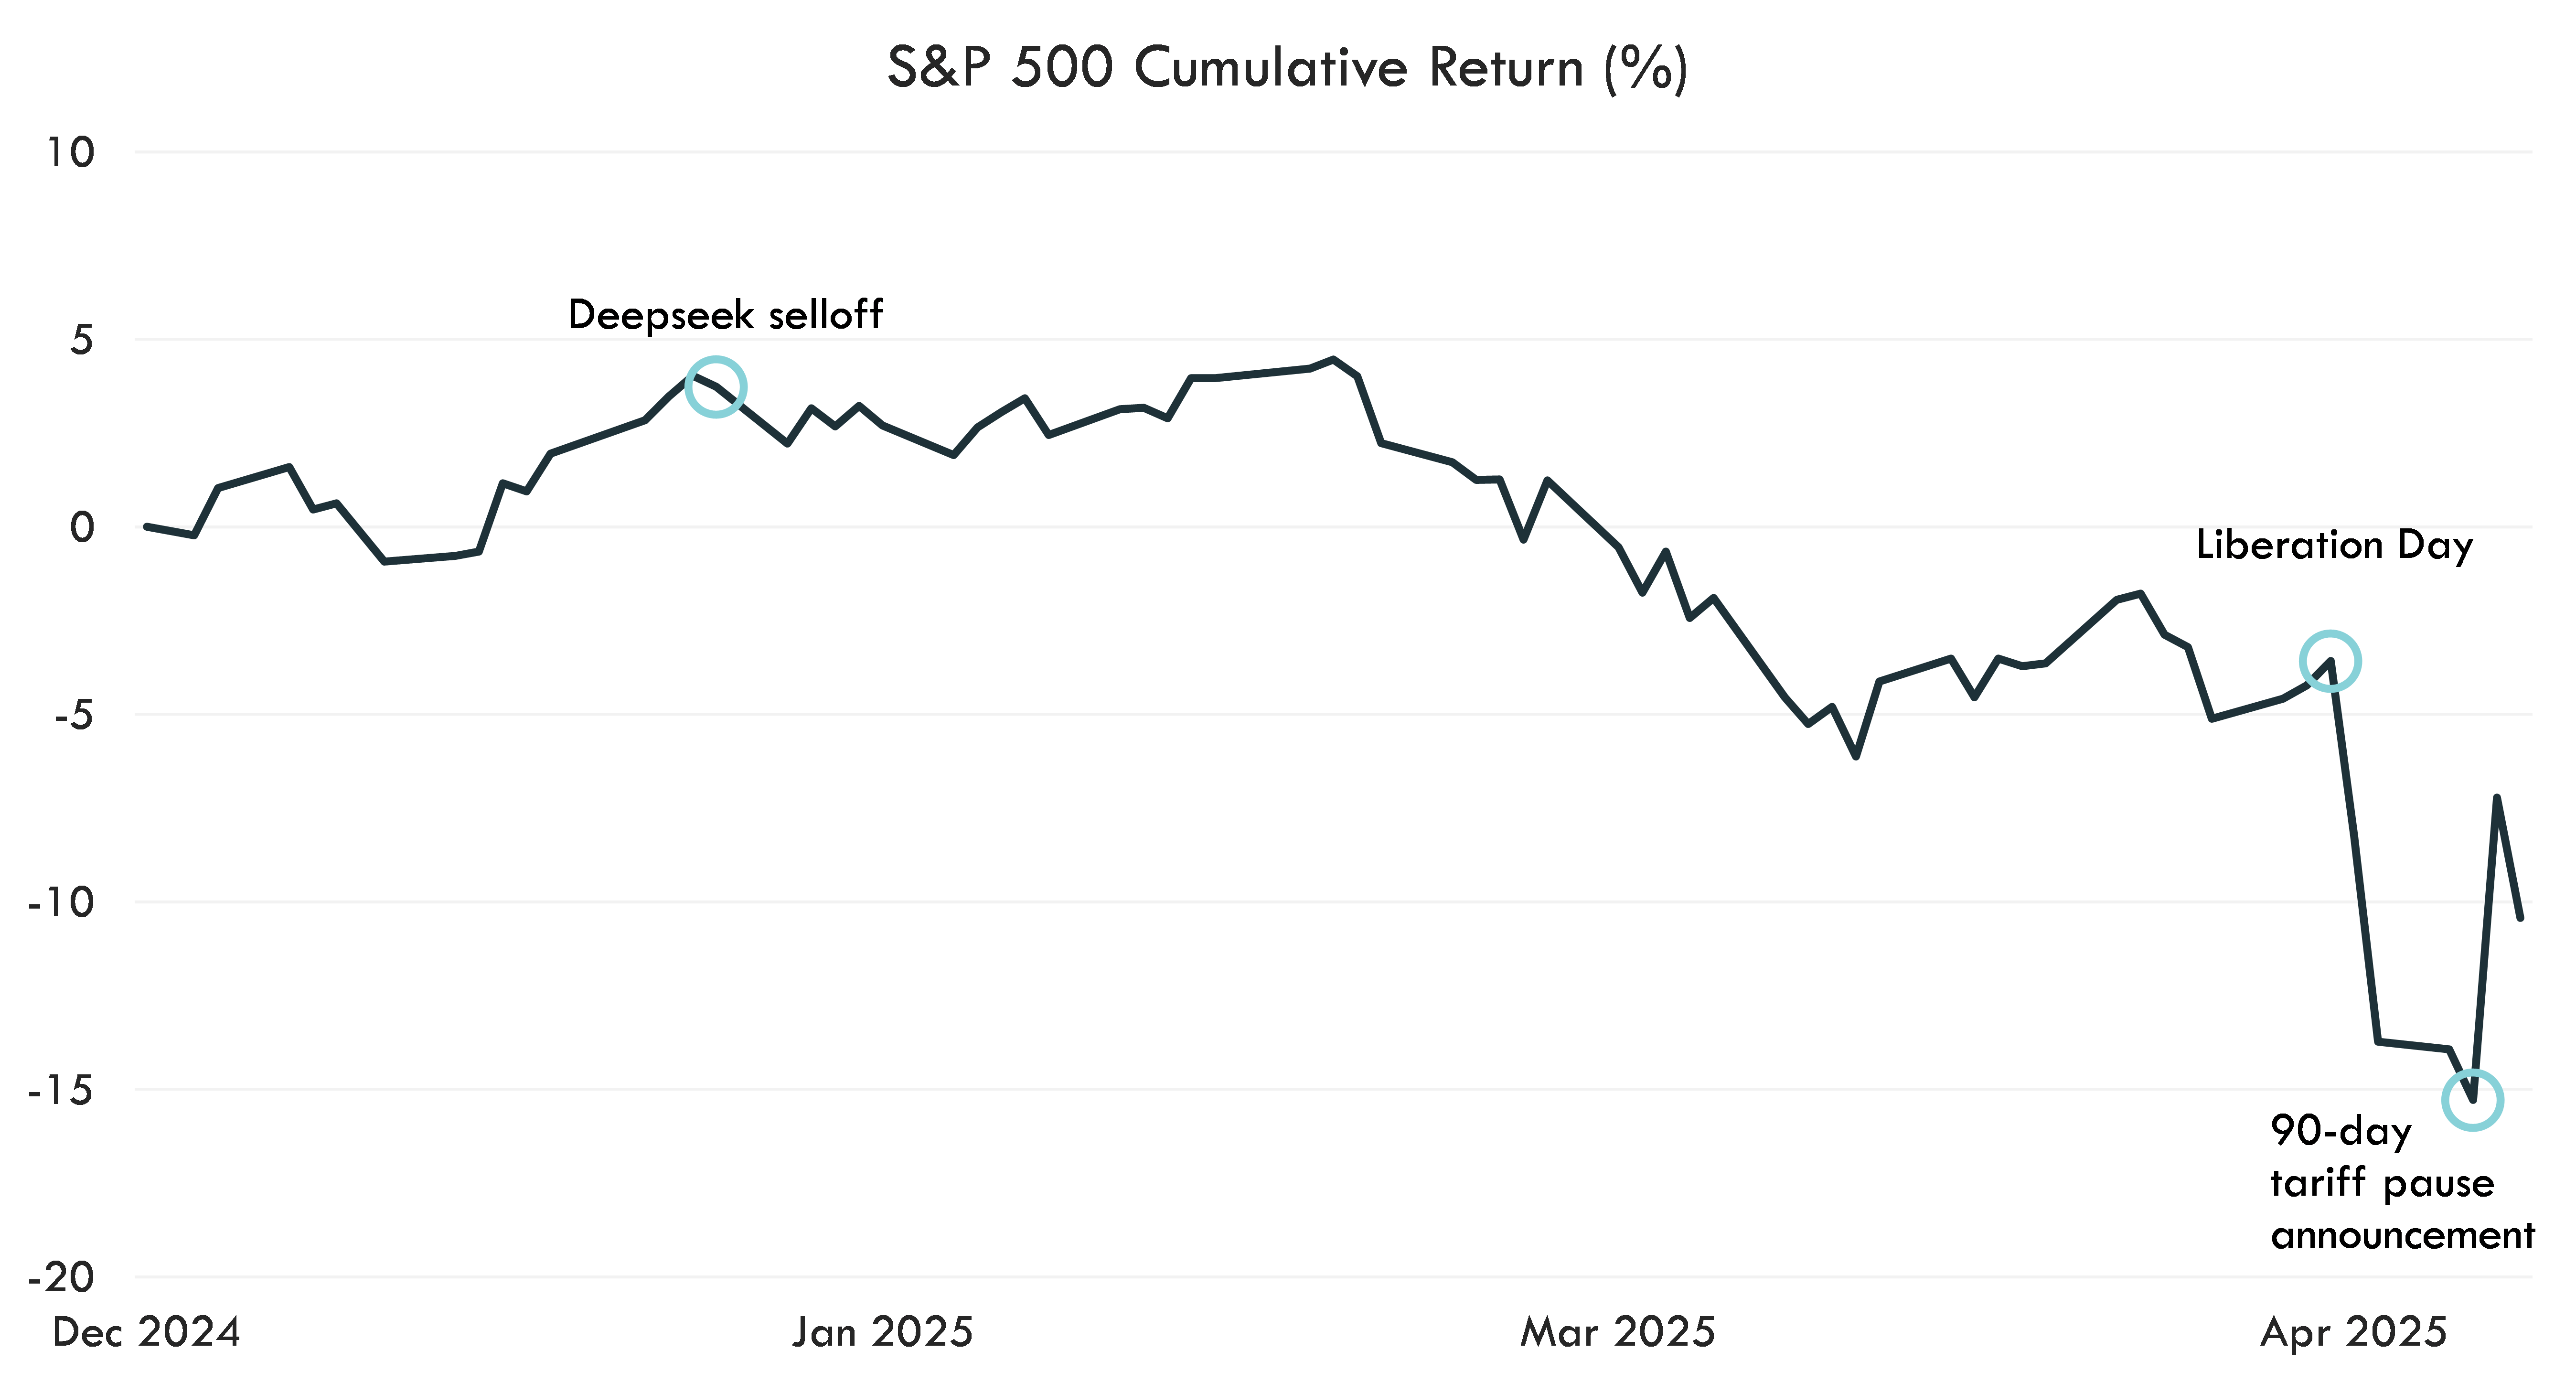
Source: Bloomberg, Innovator. Daily S&P 500 Index data from 12/31/2024 - 4/10/2025. Past performance is not necessarily indicative of future results. One cannot invest directly in an index. Index performance does not account for fees and expenses.
Bear Markets Have Occurred About 1.5 Years After Recovery
For simplicity, we define a bear market as a decline of about 20% from a peak. A new bear market cannot start until we have fully recovered to the previous starting peak. Using this methodology, market participants historically have 17 months (median) between the recovery to a prior peak and the start of the next bear market. The Global Financial Crisis and economic stagnation period of the early 1970s led to such extended drawdowns that market participants had to wait about 4 and 6 years respectively to climb to the prior peak. In each of these scenarios, investors only had ~4 months to prepare their portfolios for the beginning of another bear market.
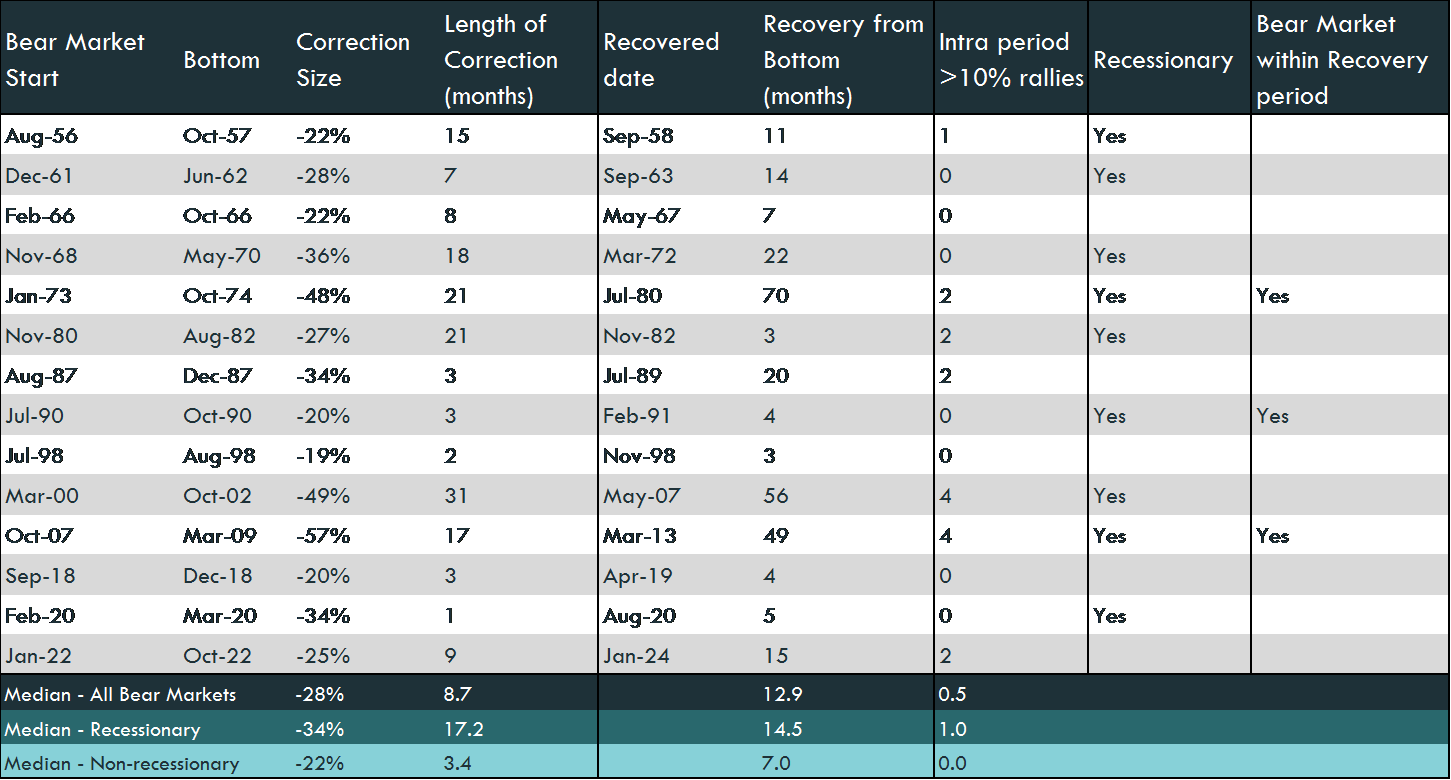
Source: Bloomberg, Innovator. Bear market figures have been calculated using the price return of the S&P 500 Index. Recessionary periods are classified by the National Bureau of Economic Research. Past performance is not necessarily indicative of future results. One cannot invest directly in an index. Index performance does not account for fees and expenses.
Not All Bears Are Created Equal
A clear distinction exists between recessionary bear markets and non-recessionary bear markets. First, recessionary bear markets led to extended downturns that took longer to reach a bottom than the non-recessionary type. While non-recessionary bear markets took just over 3 months (median) to find a bottom, recessionary bears took over 5x that time at 17 months.
Recession-induced bear markets had deeper troughs, falling 34% (median) with a maximum decline of 57% during the Global Financial Crisis. In the absence of a recession, bear markets have fallen by 34% at most (as seen in the late 1980s) but had a median drop of only 22%. The larger drawdowns associated with recessionary bear markets also had longer recovery times at about 15 months (median), more than doubling non-recessionary recoveries.
Despite understanding that a typical recessionary bear market has been worse in terms of length of drawdown, depth of decline, and duration of recovery, investors often don't know that a recession has begun until after the fact. Intra-period rallies between the peak and the bottom pose another challenge to investors positioning themselves for market weakness.
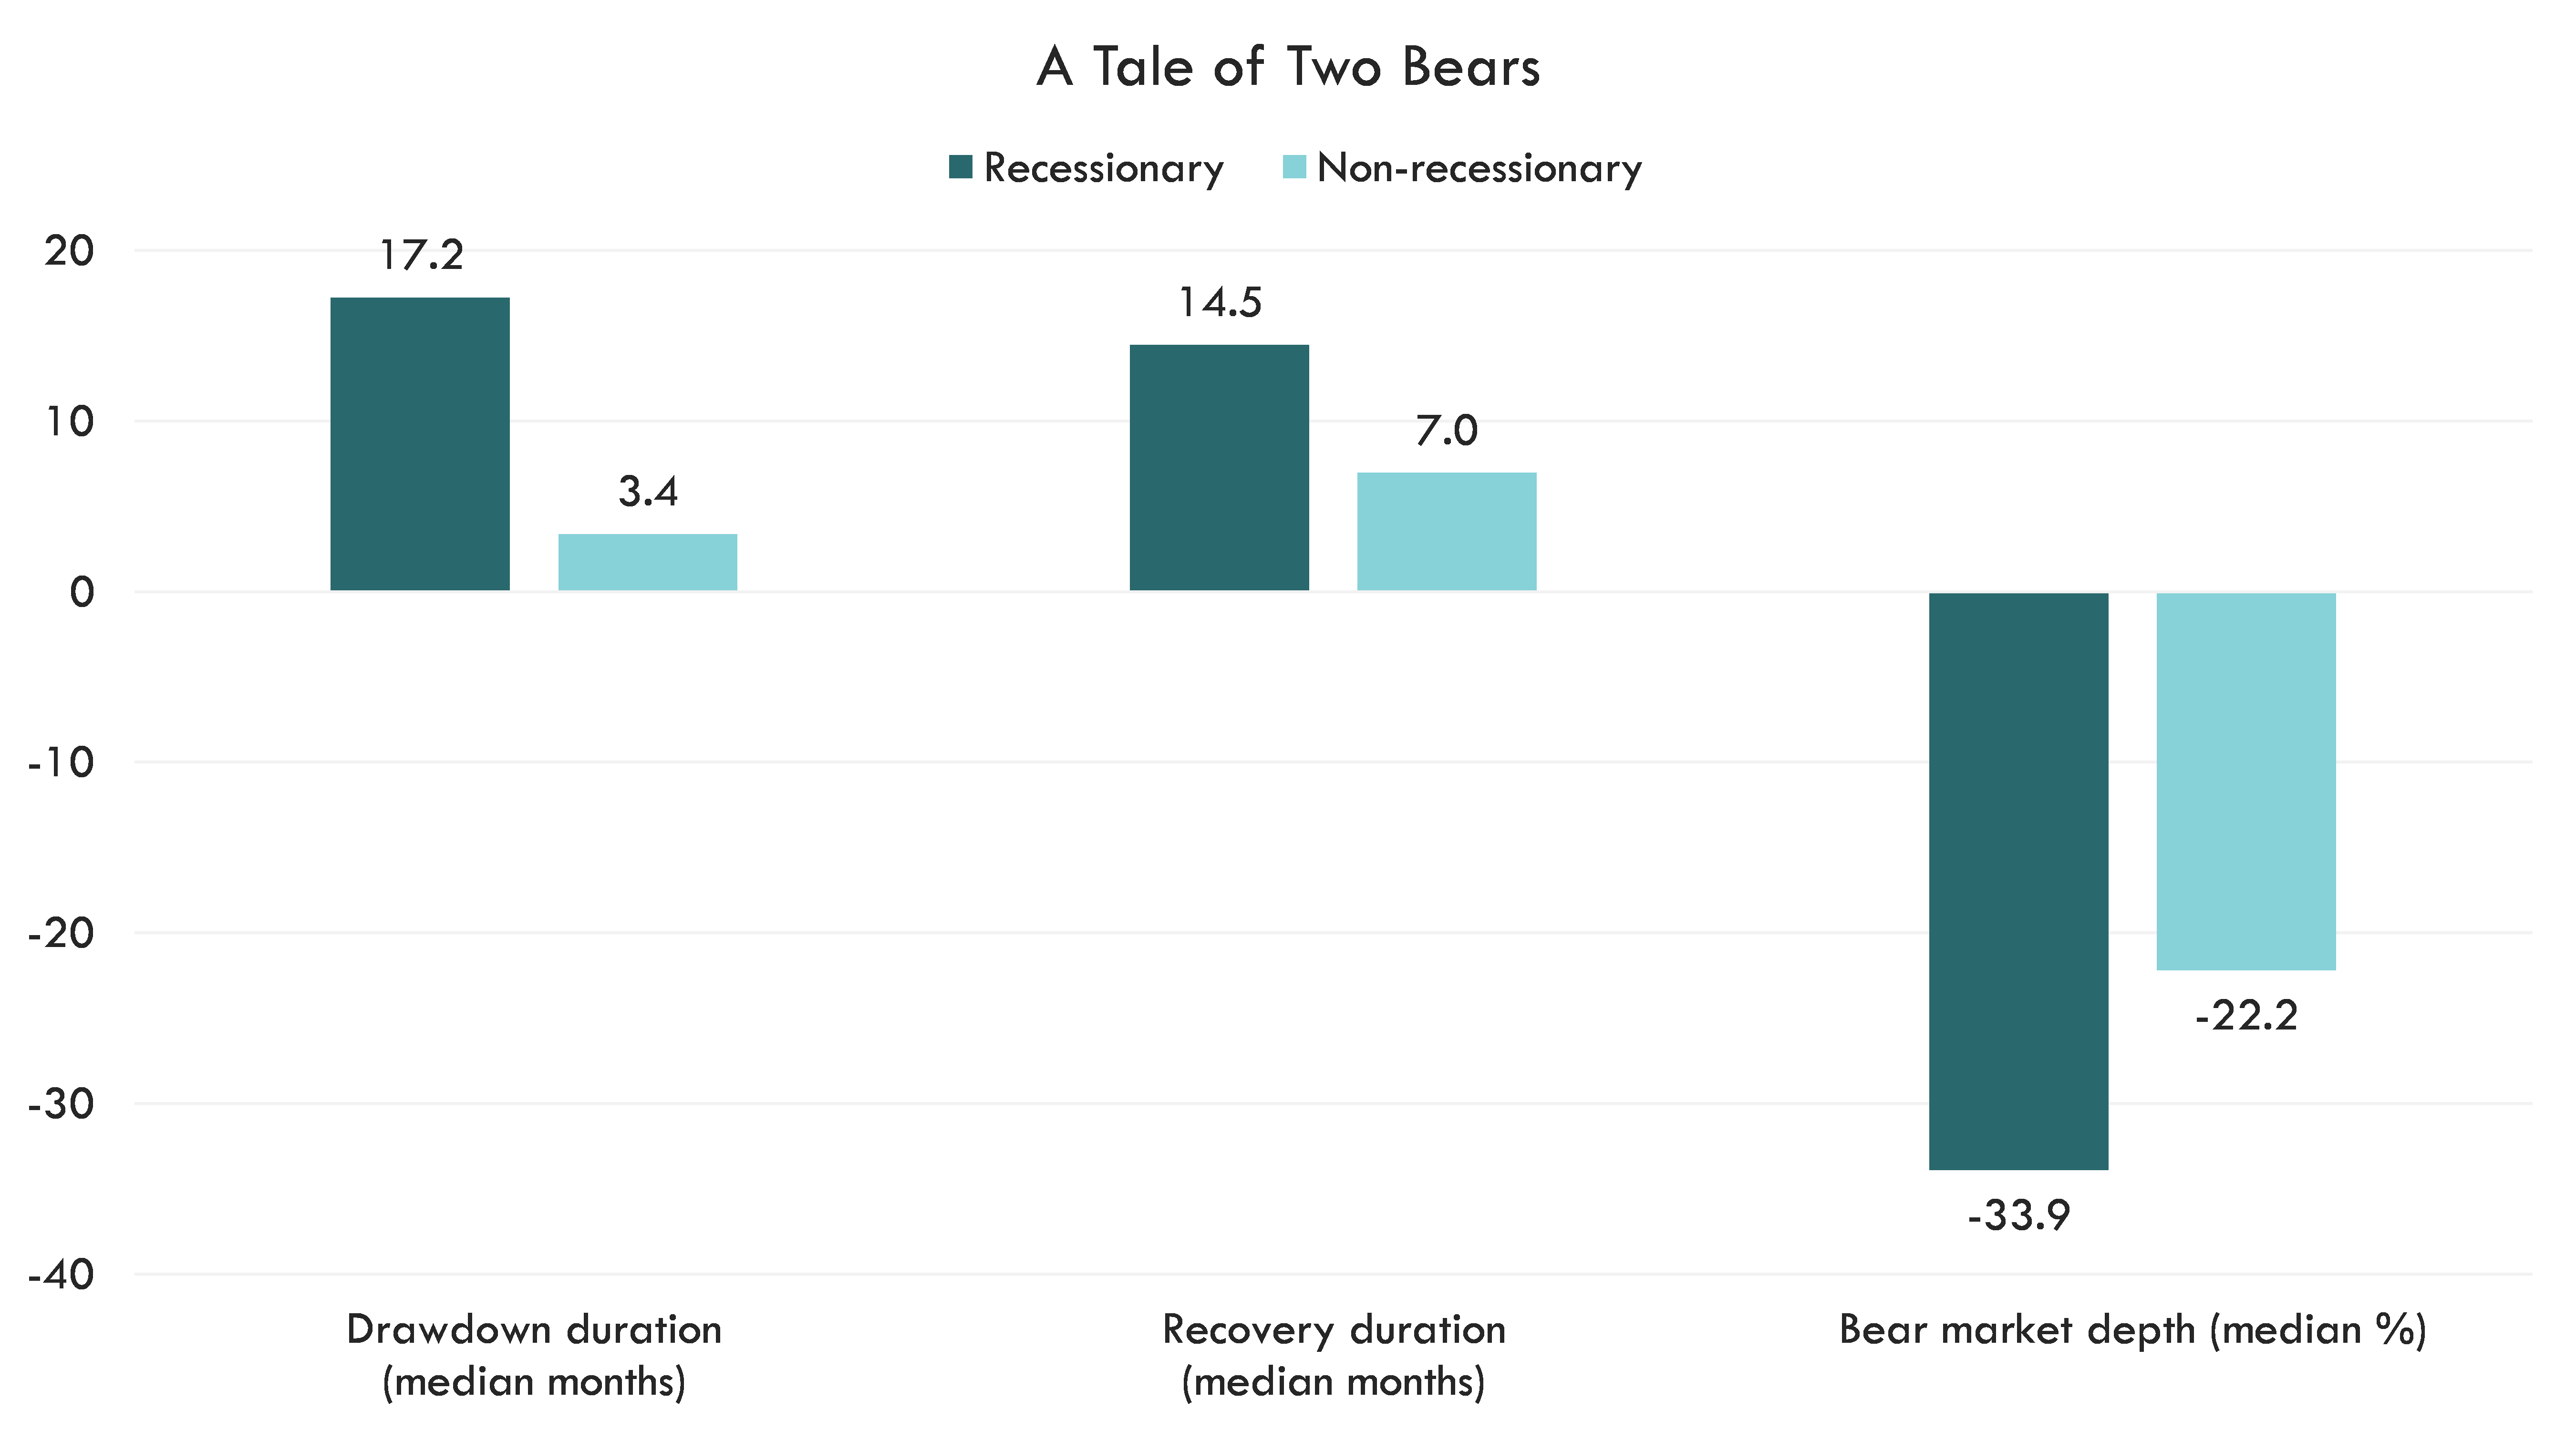
Source: Bloomberg, Innovator. S&P 500 Index bear markets evaluated from 1950 through October 2022. Past performance is not necessarily indicative of future results. One cannot invest directly in an index. Index performance does not account for fees and expenses.
Intra-period rallies are common
Volatile market periods challenge investors for many reasons. No matter how well-positioned a portfolio is for a bear market, emotions can creep in and lead investors to sell when they shouldn't have, potentially locking in losses. On the flip side, an intra-period bear market rally might cause someone to overinvest in risk before the market continues its downward trajectory.
For example, The Global Financial Crisis had 4 S&P 500 rallies of 10% or more, with one rally climbing approximately 24% before ultimately hitting a bottom of about -57%. In the 14 bear markets examined, at least half experienced one rally of 10% or greater. Recovery periods are no easier to interpret. During the recoveries from the Global Financial Crisis, the bear market of the early 1990s, and the early 1970s, we experienced drawdowns of ~20%+!
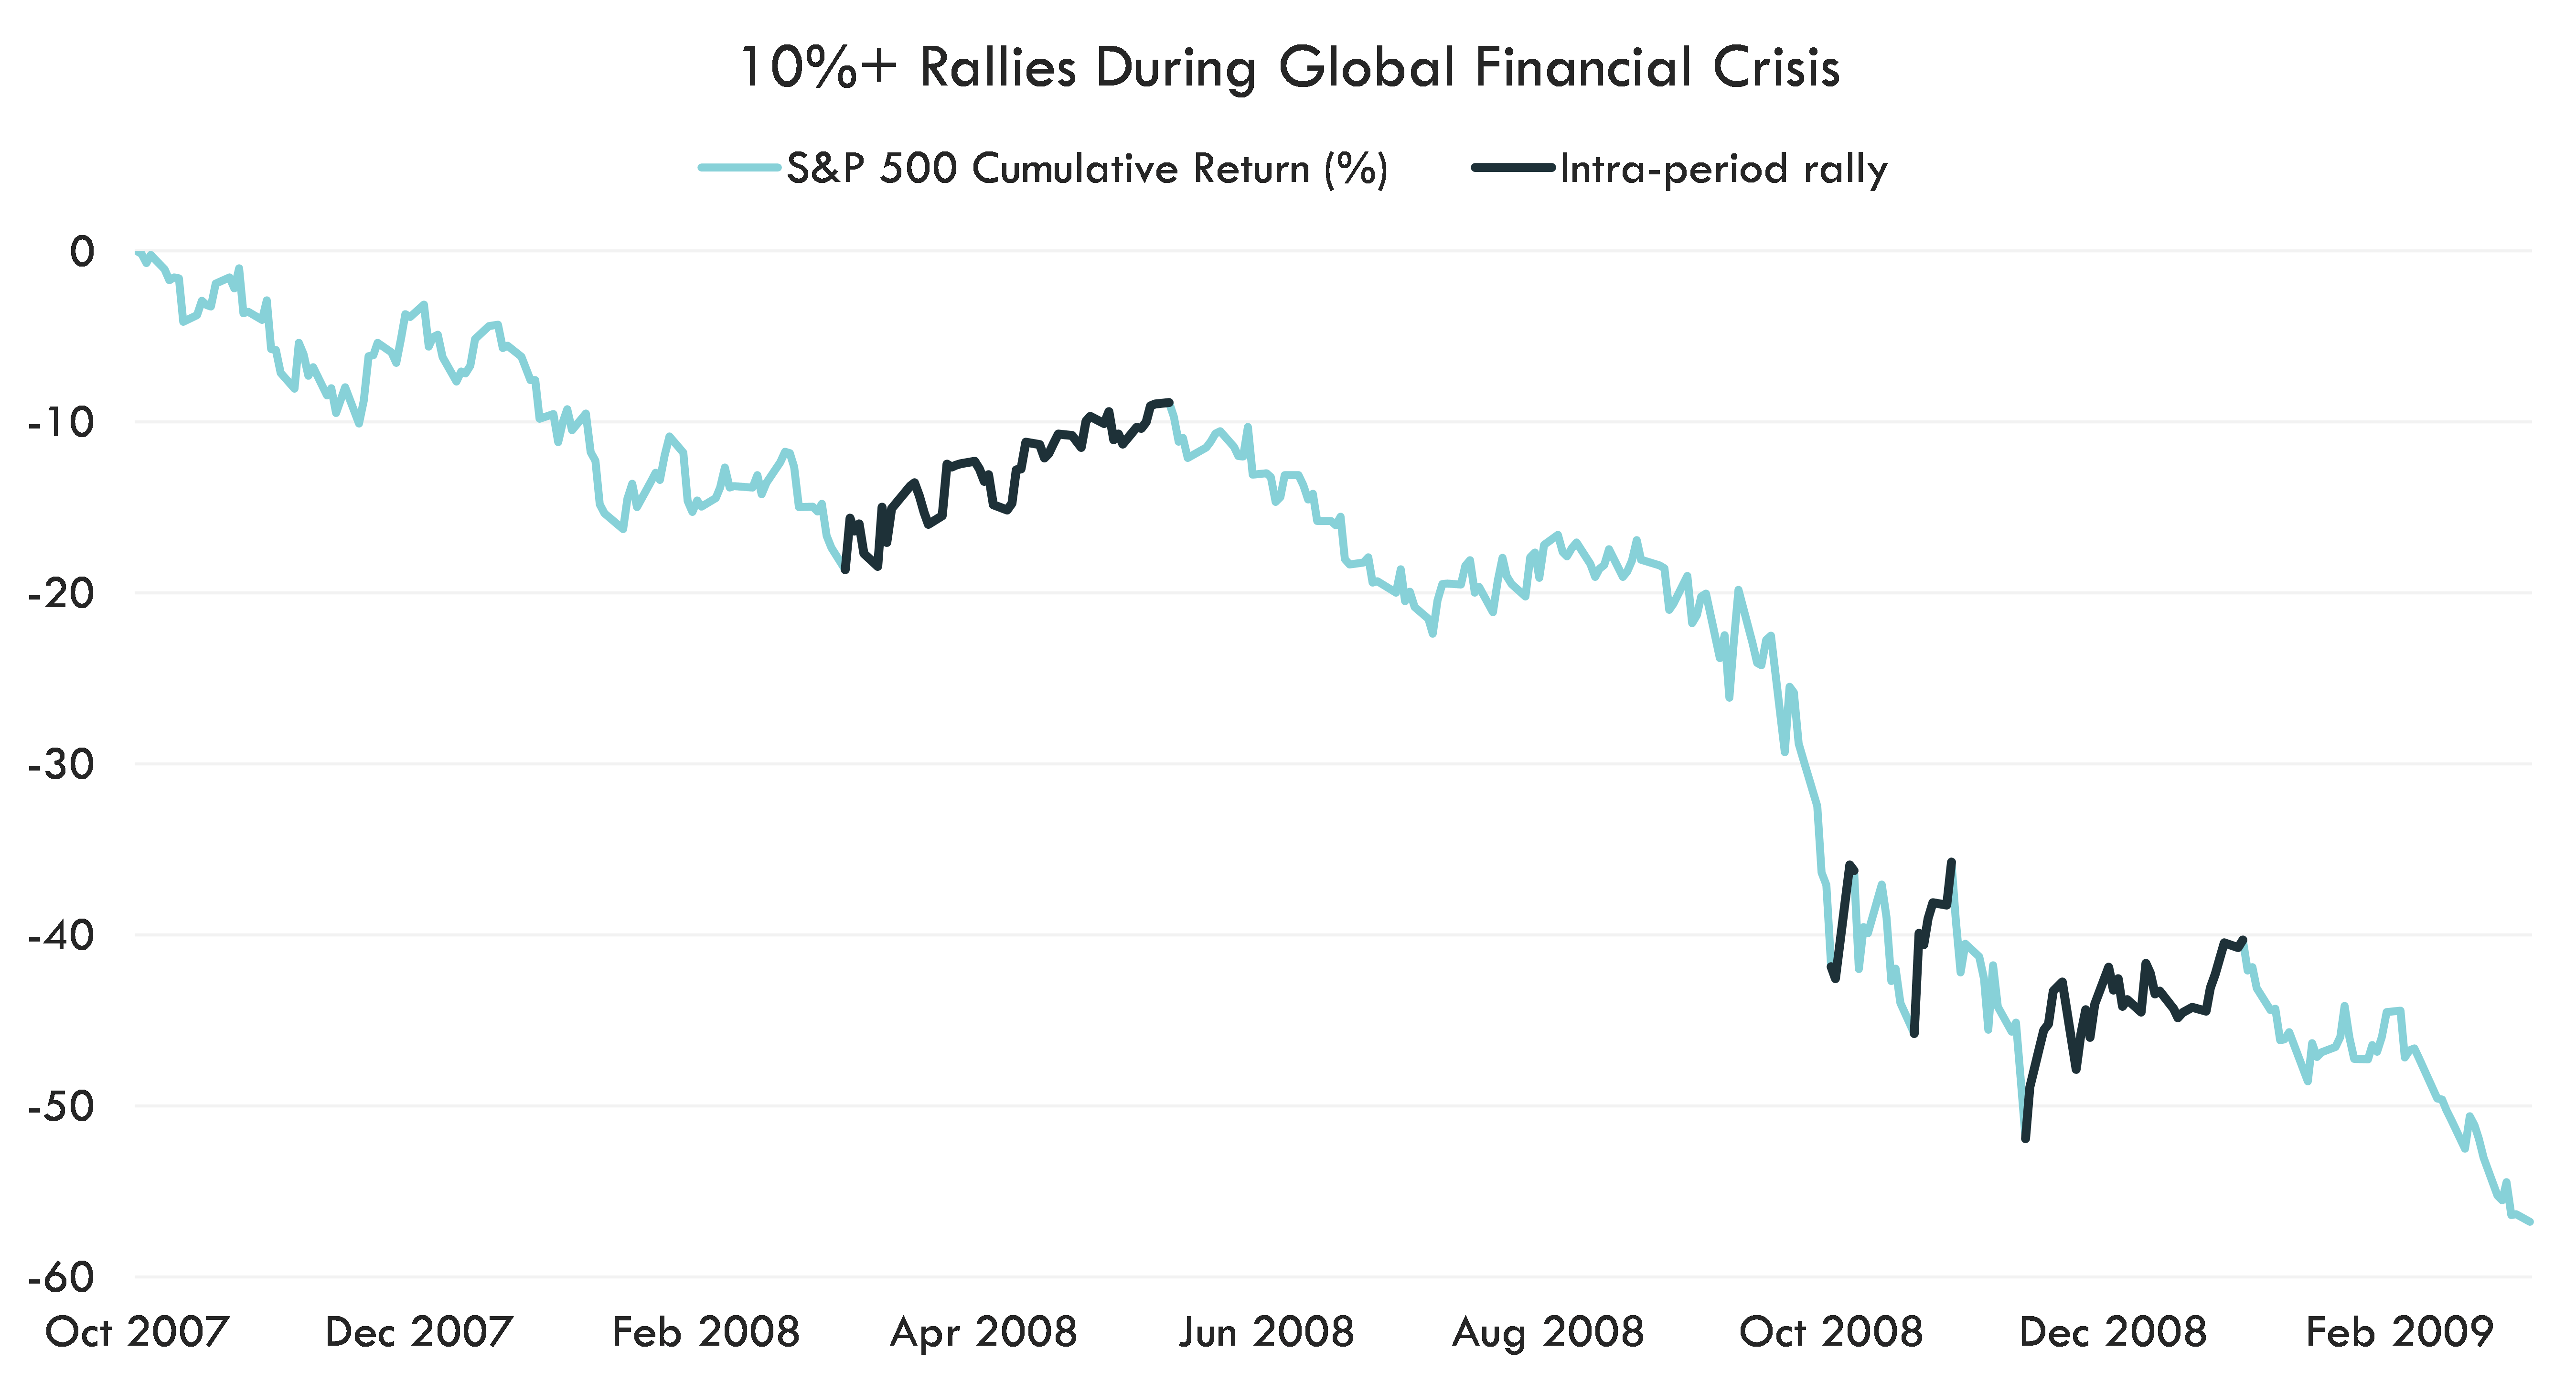
Source: Bloomberg, Innovator. S&P 500 Index daily data from 10/9/2007 - 3/9/2009. Past performance is not necessarily indicative of future results. One cannot invest directly in an index. Index performance does not account for fees and expenses.
Conclusion
Are we heading toward a recessionary bear market? The markets are still digesting President Trump's 90-day tariff delay. The S&P 500's huge 9.5% rebound already reversed course the following day, and investors seem to have no clearer picture on the Trump administration's future actions. In my view, other areas of the market indicate that we have yet to reach a bottom in 2025.
High-yield credit spreads² are at the widest levels since early 2023, when investors thought the prior year's tightening cycle would cause a recession. In 2025, oil has tracked more than 20% lower from January’s peak³, reflecting the potential for slowing economic growth. I believe investors would be prudent to position for a weakening economy until more clarity emerges from the White House on tariff policy.
1. S&P 500 Index 2025 max drawdown shown as of 4/11/2025. Max drawdown is the maximum observed loss from a peak to a trough before a new peak is attained.
2. High-yield credit spreads have been represented by the Bloomberg US Corporate High Yield Option-Adjusted Spread which is intended to measure the market’s risk premium demand for high-yield bonds.
3. Oil’s 2025 max drawdown has been shown as measured by the WTI Crude Oil Active Contract.
This material contains the current research and opinions of its author, which is subject to change without notice. This material is not a recommendation to participate in any particular trading strategy. Unless expressly stated to the contrary, the opinions, interpretations, and findings herein do not necessarily represent the views of Innovator Capital Management, LLC (“Innovator”) or any of its affiliates.
This material is provided for informational purposes only and is made available on an “as is” basis, without representation or warranty. This information is only current as of the date indicated and may be superseded by subsequent market events or for other reasons. Innovator is not providing this information as investment advice. Readers should consult with their investment and tax advisers to obtain investment advice and should not rely upon information published by Innovator or any of its affiliates. Evaluations of market conditions are only current as of the date of publishing, are subject to change without notice, and are not intended to be a forecast of investment outcomes. Innovator specifically disclaims all warranties, express or implied, to the full extent permitted by applicable law, regarding the accuracy, completeness, or usefulness of this information, including any forecasts contained herein, and assumes no liability with respect to the consequences of relying on this information for investment or other purposes.
Investing involves risk, including the loss of principal. Past performance is not necessarily indicative of future results. One cannot invest directly into an index. Index performance does not account for fees and expenses.
Certain information herein contains forward-looking statements such as “will,” “may,” “should,” “expect,” “target,” “anticipate,” or other variations of these statements. Forward-looking statements are based upon assumptions which may not occur, while other conditions not taken into account may occur. Actual events or results may differ materially from those contemplated in such forward-looking statements. References to financial instruments in this material are provided for informational purposes only and do not constitute a recommendation. The forward-looking statements contained herein do not constitute, and should not be relied upon as, investment advice. Such forward-looking statements are not necessarily based upon explicit criteria and assumptions, but rather, represent the opinions of the authors stated herein.