May 2, 2024
Exploring Premium Income Barrier Strategies in Investment Portfolios
Erik Abrell
Research Analyst
Innovator Capital Management
Abstract: In today's investment landscape, the pursuit of strategies that provide both income generation and risk management has become increasingly prominent. Buffered strategies and structured notes have long been favored for their ability to mitigate losses while offering capped upside potential. Recently, Innovator introduced a novel approach to the ETF market: premium income barrier strategies. These strategies aim to shield against a portion of losses while offering predetermined income levels, primarily appealing to investors seeking alternatives to traditional bonds. However, concerns persist regarding potential breaches of barrier levels and subsequent losses. This paper delves into the dynamics of barrier strategies, their historical performance, and strategic implementations to mitigate associated risks.
Introduction: Premium income barrier strategies represent a promising avenue for investors seeking to balance income generation with risk management in their portfolios. By defining thresholds for protection and income generation, these strategies offer a unique value proposition, particularly within fixed income allocations. Nevertheless, apprehensions regarding the impact of breaching barrier levels persist among investors. This paper aims to provide a comprehensive analysis of barrier strategies, drawing on historical data and strategic insights to elucidate their potential benefits and address concerns.
Historical Analysis: The cornerstone of evaluating premium income barrier strategies lies in understanding historical market behavior and the frequency of adverse events. Analyzing data from the S&P 500 since 1950 reveals compelling insights. Notably, negative market environments, while not uncommon, occur less frequently than positive ones. With only 26% of instances showcasing negative returns over a one-year period, the probability of breaching barrier levels diminishes significantly. Furthermore, extreme downturns, such as those exceeding a 40% decline, are exceedingly rare, transpiring in less than 0.3% of cases.
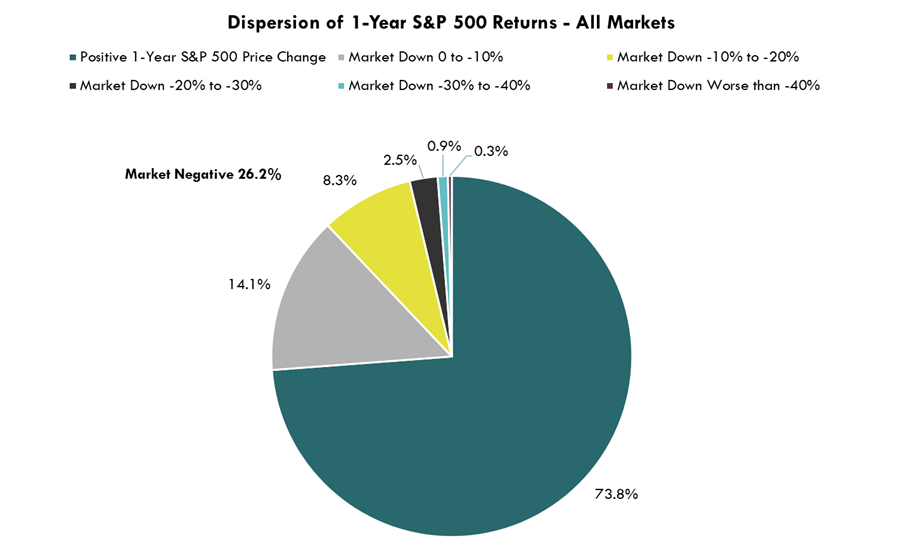
Source: Bloomberg LP, SPX Index Price Change, data as of 12/31/1949 – 2/29/2024
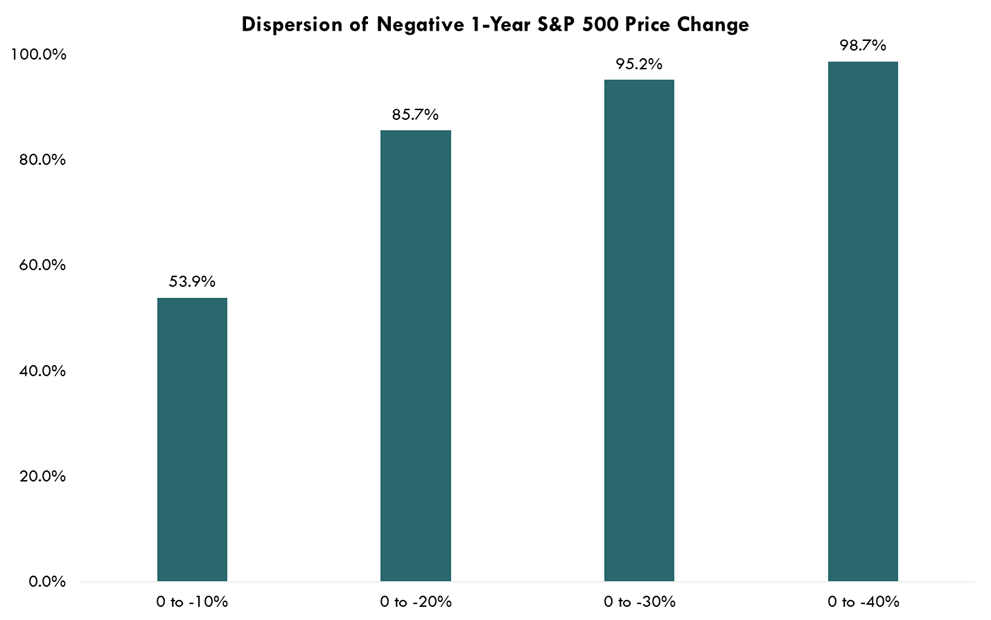
Source: Bloomberg LP, SPX Index Price Change, data as of 12/31/1949 – 2/29/2024
Strategic Implementation: Strategic implementation plays a pivotal role in optimizing the effectiveness of barrier strategies within investment portfolios. One noteworthy approach involves staggering the deployment of barrier strategies on a quarterly basis, thereby diversifying timing and market risk exposure. Historical analysis underscores the efficacy of this method, showcasing reduced instances of consecutive breaches during adverse market conditions. By spreading out barrier exposures, investors can potentially mitigate downside risks and enhance portfolio resilience.
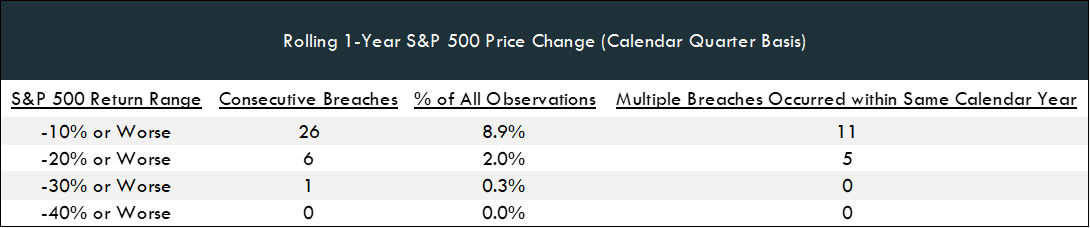
Source: Bloomberg LP, SPX Index Price Change, 12/31/1949 – 12/29/2024
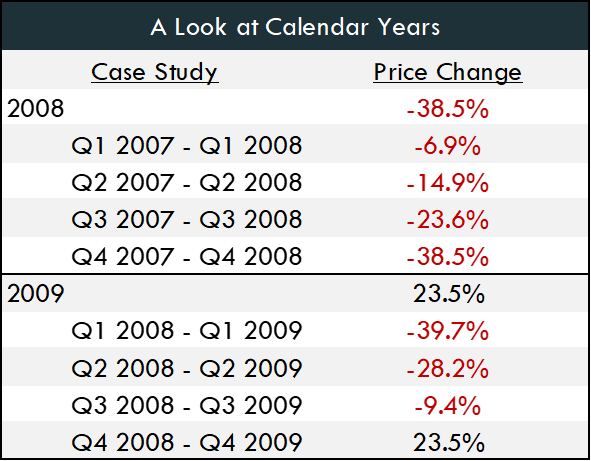
Source: Bloomberg LP, SPX Index Price Change, as of 12/31/2007 – 12/31/2009
Income Distribution Modeling: Modeling income distributions provides valuable insights into the potential returns of barrier strategies under varying market conditions. Regression analyses, incorporating factors such as volatility and interest rates, reveal median distribution rates and historical highs, offering clarity on income expectations. Notably, during periods of heightened market stress, such as the Global Financial Crisis, distribution rates may surge, potentially bolstering the attractiveness of barrier strategies as income-generating assets.
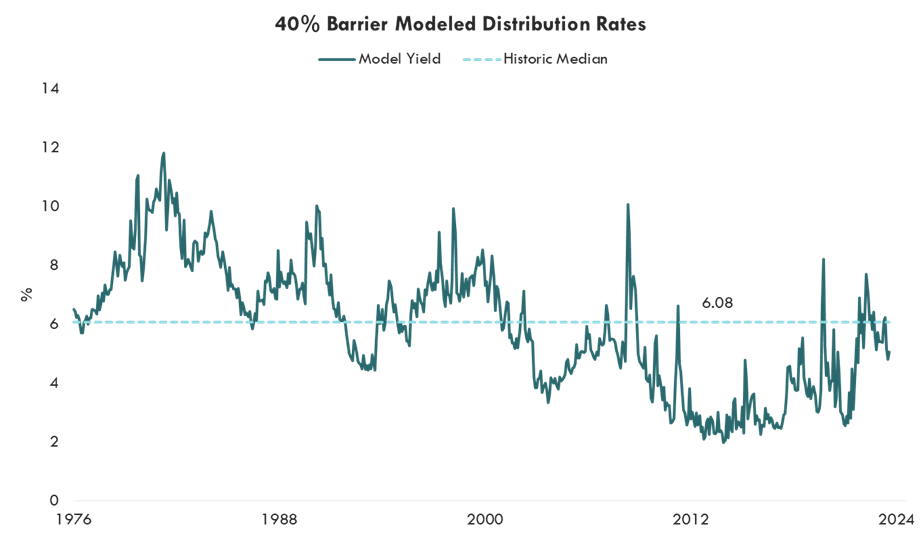
Source: Bloomberg, MerQube, Innovator Research & Investment Strategy. Model yields of the strategy are determined by running a regression analysis on the hypothetical caps of MerQube's strategy index (MQU4RC01 Index, MQU4RC04 Index, MQU4RC07 Index, MQU4RC10 Index). The independent variables are 2-year U.S. Treasury Yields and the volatility 5 days prior to the outcome period before 1990. After 1990, 2-year U.S. Treasury Yields are used with the VIX Index. Data from 6/30/1976 to 2/29/2024. Historical Median is calculated by taking the median of all data points.
Conclusion: In conclusion, premium income barrier strategies may present a compelling proposition for investors seeking income generation coupled with risk management. While concerns regarding barrier breaches persist, historical analysis demonstrates their infrequency, particularly in severe market downturns. By employing strategic implementations, such as quarterly laddering, investors can further mitigate risks and enhance the resilience of their portfolios. With a clear understanding of historical performance and strategic approaches, barrier strategies may emerge as a viable long-term solution within fixed income allocations, providing income stability and downside mitigation diverse market conditions.
FOR FINANCIAL PROFESSIONAL USE ONLY
The Funds have characteristics unlike many other traditional investment products and may not be suitable for all investors. For more information regarding whether an investment in the Fund is right for you, please see “Investor Suitability” in the prospectus.
The funds do not provide a buffer against all underlying ETF losses or a floor that provides a maximum amount of underlying ETF losses, which could cause loss of the entire investment prior to consideration of any defined distribution payments. The outcomes that the Fund seeks to provide may only be realized if you are holding shares on the first day of the Outcome Period and continue to hold them on the last day of the Outcome Period, approximately one year. There is no guarantee that the Outcomes for an Outcome Period will be realized or that the Fund will achieve its investment objective.
Investment Objective: The Funds seeks to provide investors, over a 1 year outcome period, with an investment that provides a high level of income through a Defined Distribution Rate that is not subject to any losses experienced by the U.S. Equity Index that are at or below the respective Barrier (10,20,30,40) and is subject to initial losses experienced by the U.S. Equity Index beginning at the Barrier and to the full extent of U.S. Equity Index losses on a one-to-one basis beginning after the barrier threshold has been crossed.
The Defined Distribution Rate is based upon a rate that is comprised of the income generated by the U.S. Treasuries and the premiums received from the Fund selling FLEX Options. The Defined Distribution Rate is likely to rise or fall from one Outcome Period to the next. Account fees will lower the Defined Distribution Rate received by shareholders.
Over each Outcome Period, shareholders will also be subject to U.S. Equity Index losses that are based upon an investment "barrier," which is an investment strategy whereby a payoff depends on whether an underlying asset has breached a predetermined performance level. The Funds seek to provide a pre-determined barrier at [respectively 10, 20, 30, or 40]% of U.S. Equity Index losses for each Outcome Period (the "Barrier") by selling FLEX Options that reference the U.S. Equity Index for each Outcome Period (the "Barrier Options"). There is no guarantee that the Fund will be successful in its attempt to implement the Barrier.
Fund shareholders also will be subject to all losses experienced by the U.S. Equity Index if the U.S. Equity Index experiences losses that exceed the Barrier at the end of the Outcome Period. If at the end of the Outcome Period the U.S. Equity Index has experienced a positive price return, or price return losses that are less than the Barrier, the Fund is designed to provide returns that equal the Distribution Rate. However, if the U.S. Equity Index has decreased in value below the Barrier at the end of the Outcome Period, the Fund's investments will generate Outcomes that equal the Distribution Rate less the entirety of the U.S. Equity Index's losses over the course of the Outcome Period. The Fund will not benefit from any increases in the U.S. Equity Index over the course of an Outcome Period but is subject to the possibility of significant losses experienced by the U.S. Equity Index if the value of the U.S. Equity Index drops below the Barrier at the end of the Outcome Period. An investor could lose its entire investment. The Fund will not receive or benefit from any dividend payments made by the constituents of the U.S. Equity Index.
A shareholder may lose its entire investment. In the event an investor purchases Shares after the commencement of the Outcome Period or sells Shares prior to the expiration of the Outcome Period, the Barrier that the Fund seeks to provide may not be available. In addition, the operationality of the Barrier is such that the Fund may experience dramatic changes in value of its NAV at the end of the Outcome Period, even if the changes in the U.S. Equity Index are minimal. If the U.S. Equity Index's value is at or near the Barrier at the end of the Outcome Period, small changes in the value of the U.S. Equity Index could result in dramatic changes in the value of the Barrier Options and therefore the Fund's NAV. Investors should understand these risks before investing in the Fund.
The Outcomes may only be realized by investors who continuously hold Shares from the commencement of the Outcome Period until its conclusion. Investors who purchase Shares after the Outcome Period has begun or sell Shares prior to the Outcome Period's conclusion may experience investment returns very different from those that the Fund seeks to provide.
The Funds' website, www.innovatoretfs.com, provides important Fund information as well as information relating to the potential outcomes of an investment in a Fund on a daily basis.
The Fund uses its net assets (including the premiums received by selling Barrier Options) to purchase U.S. Treasuries that expire at the end of the Outcome Period. The U.S. Treasuries are entitled to an interest rate, which when added to the premiums received for selling Barrier Options, produce the Distribution Rate. The Distribution Rate is distributed to shareholders in Fund Distributions. The amount of the Fund Distributions is dependent, in part, upon the income received from the U.S. Treasuries, which is not guaranteed. If the U.S. Treasuries fail to pay income or pay less income than anticipated, the Distribution Rate will not be obtained, and a Fund Distribution will be less than anticipated.
FLEX Options Risk The Fund will utilize FLEX Options issued and guaranteed for settlement by the Options Clearing Corporation (OCC). In the unlikely event that the OCC becomes insolvent or is otherwise unable to meet its settlement obligations, the Fund could suffer significant losses. Additionally, FLEX Options may be less liquid than standard options. In a less liquid market for the FLEX Options, the Fund may have difficulty closing out certain FLEX Options positions at desired times and prices. The values of FLEX Options do not increase or decrease at the same rate as the reference asset and may vary due to factors other than the price of reference asset.