August 9, 2024
Revolutionizing Risk Management with the 10% Managed Floor Strategy
Erik Abrell
Research Analyst
Innovator Capital Management
Differences Between Traditional Buffers and Managed Floors
Buffered strategies have been employed for some time as a risk-managed solution. The core idea is that the "buffer" aims to cushion the initial losses, offering a 1-to-1 upside up to a predetermined cap over a specific period. While buffered strategies continue to have a place in portfolios, a new approach, the 10% managed floor strategy, has emerged. This strategy exposes investors to the first 10% of losses but is designed to limit further drawdowns. The purpose of the 10% managed floor strategy is similar, implementing built-in risk management, but the way in which it’s achieved is different.
The 10% Managed Floor Structure
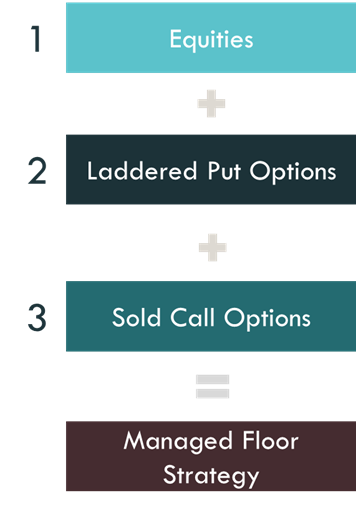
The 10% managed floor strategy uses a systematic, three-layer, option overlay approach:
1. Equity Index Sampling: Holding a sample of individual stocks from an equity index like the S&P 500 or NASDAQ-100.
2. Laddered Put Options: Purchasing four 10% out-of-the-money puts on a quarterly basis to provide the "floor" for the strategy.
3. Call Selling Strategy: Selling 20-delta call options bi-weekly, typically written 2.5% to 3% out-of-the-money, to finance the floor and potentially generate additional returns.
For illustrative purposes only
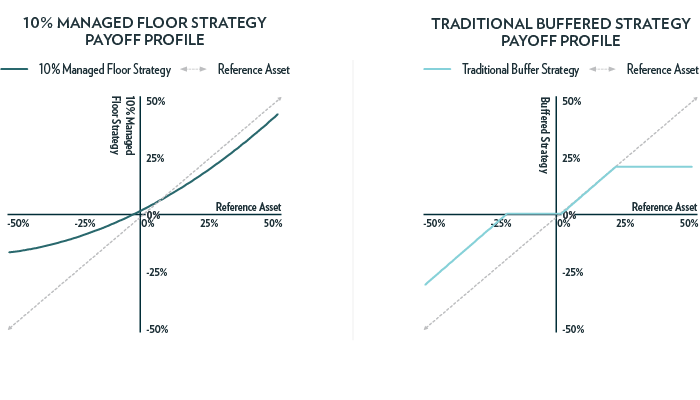
This structure creates a convex payoff profile, meaning that losses occur at a decelerating rate, hedging against black swan events. On the upside, the participation is perpetual, designed to capture over 70% of the upside of an equity index, and reduce volatility. This payoff profile can minimize or leverage significant events in an equity market, such as the Tech Bubble, the Global Financial Crisis, or a booming bull market.
For illustrative purposes only
Tail Risk Hedge
Investors seek risk-managed solutions primarily to hedge against black swan scenarios. These are significant events that can cause mass hysteria, and most importantly, can take multiple years to recover from. This is why the 10% managed floor strategy was created, based around the principle that investors are able to withstand a market correction of ~10%, but cannot afford to be exposed to severe losses. By purchasing and laddering out 10% out-of-the-money put options, (i.e. protective puts), investors are hedging their equity positions by implementing an instrument that is inversely correlated with an equity index. In simple terms, as the index decreases, the value of these put options increase.
When looking back at historical losses of the S&P 500, we find that the major drawdowns are remembered, such as the Tech Bubble or Global Financial Crisis, despite normal market corrections of -5% to -10% being more frequent.
The table below depicts every mutually exclusive S&P 500 drawdown between -5% and -10% since 1990. These market corrections happen fairly often, almost every year or so, with the median recovery time of 23 trading days. In theory, the 10% managed floor strategy would not be in a free fall with the market, given the laddered put options would increase in value. These are the types of drawdowns that most investors can stomach, and typically aren’t cause for panic, deeper drawdowns, however, are events that a majority of investors wish to avoid.
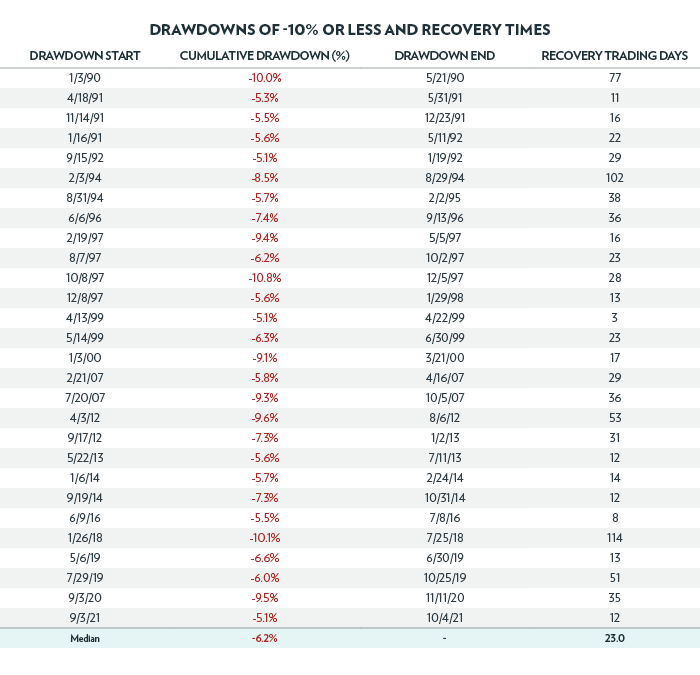
Source: Bloomberg LP, S&P 500 Index, as of 1/3/1990 – 10/4/2021.
Past performance is not indicative of future results. Indexes cannot be invested in directly.
The chart below illustrates the performance of the Nasdaq-100 and S&P 500 indices during two major events: the Tech Bubble and the Global Financial Crisis. First, examining the Nasdaq-100 during the Tech Bubble, we observe that the index experienced a maximum drawdown of -83%. To contextualize this decline, the Nasdaq-100 required a gain of over 400% to return to its pre-bubble levels, which took nearly 15 years. The "boom or bust" nature of the Nasdaq-100, where the average 12-month negative return is -23.2%, demonstrates how investors can benefit from a 10% managed floor strategy on the NASDAQ-100. This approach can help smooth out returns, potentially reduce recovery times, and maintain exposure to the technology sector.
The lower part of the chart also shows the performance of the S&P 500 during the Tech Bubble and the Global Financial Crisis. The index experienced maximum drawdowns of -47% and -55%, taking 6.13 and 4.49 years to recover from, respectively. The overall trend across both events and indices highlights that major drawdowns can require years for recovery. Investors who are risk adverse, nearing retirement, or in retirement, can benefit from limiting exposure to these types of massive drawdowns.
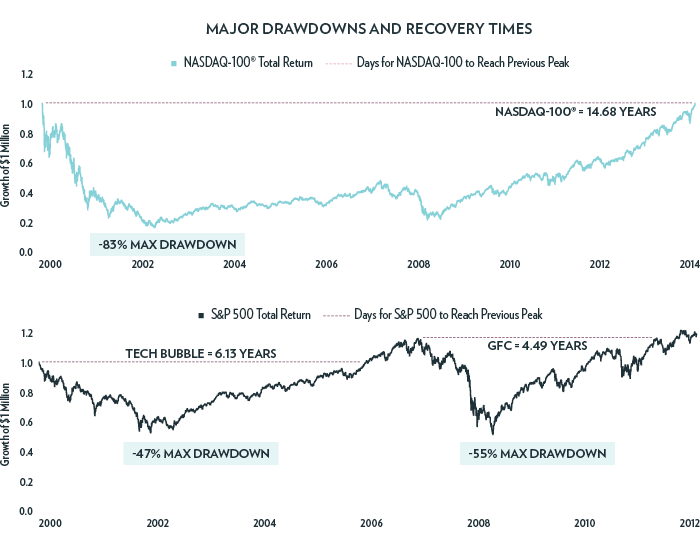
Source: Bloomberg LP, S&P 500 Index, NASDAQ-100 Index, as of 12/31/1999 – 11/26/2014
Past performance is not indicative of future results. Indexes cannot be invested in directly.
Perpetual Upside Capture
In terms of the strategy’s upside, unlike a traditional buffered strategy where there is a predetermined cap in place, the 10% managed floor strategy can have over a 70% participation rate of an equity index. This can primarily be attributed to the physical sampling of an equity index, along with the bi-weekly call writing strategy, creating perpetual upside participation.
In the previous section, "Tail Risk Hedge," we discussed how recovering from major drawdowns can take multiple years. This is mainly because deeper losses require more substantial returns. To illustrate this, the table below shows the return needed to "breakeven" from various losses, highlighting the importance of limiting drawdowns and capturing a significant portion of capital during the recovery phase. For example, a 10% loss would require an 11% positive return to recover. To put this in perspective, since 1950, the average 1-year return of the S&P 500 is 12.6%.
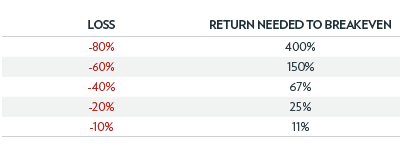
For illustrative purposes only.
Major drawdowns, or bear markets, can often serve as catalysts for new bull markets. Investors who remain in cash or use strategies with limited upside potential risk missing out on the wealth generation these periods can provide. As shown in the chart below, since 1990, the average bull market has lasted approximately 5.9 years, with an average annualized return of around 24%. For instance, during the Tech Bubble, the S&P 500 experienced a 2.4-year bear market followed by a 4.6-year bull market with an annualized return of 16.5%. Similarly, following the 1.5-year bear market during the Global Financial Crisis, a 10.8-year bull market ensued, yielding an annualized return of 15.9%.
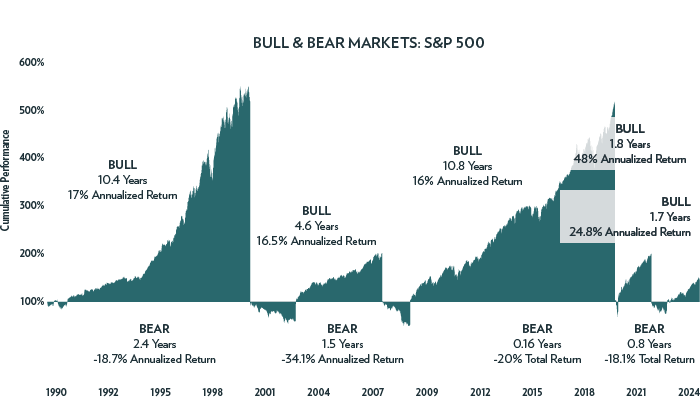
Source: Bloomberg LP, S&P 500 Index, as of 1/3/1990 – 7/31/2024
Past performance is not indicative of future results. Indexes cannot be invested in directly.
These are the types of strong runs that investors don’t want to miss out on and can be detrimental to wealth creation. Other popular core equity strategies, such as low volatility, can miss out on a substantial portion of these bull market environments. When looking at the five bull markets in the chart above, the S&P 500 has outperformed the S&P 500 Low Volatility Index in every scenario.
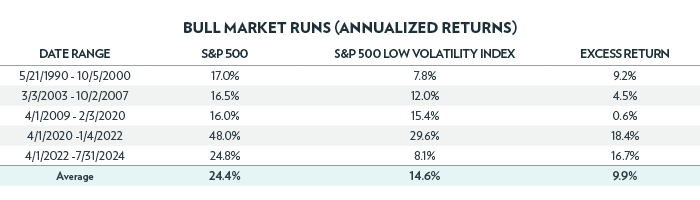
Source: Bloomberg LP, S&P 500 Index, S&P 500 Low Volatility Index, as of 1/3/1990 – 7/31/2024
Past performance is not indicative of future results. Indexes cannot be invested in directly.
With an average excess return of around 10%, this is why tying dollars to the S&P 500 is so important for creating generational wealth. Looking at the table above, even if we cut the S&P 500 return by 30%, the annualized return is still 17.1%, which is 2.5% higher than the average S&P 500 Low Volatility Index return. Unlike traditional low volatility, or other factor-based strategies, the 10% managed floor strategy can directly sample the S&P 500, benefiting from the perpetual upside in strong return environments.
Evergreen Risk Managed Solution
Regardless of market environment - whether the S&P 500 is at all-time-highs, all-time-lows, or in a bull / bear market - the 10% managed floor strategy allows investors to stay invested in equities with a measure of risk management. The tail risk hedge the strategy provides can help mitigate drawdowns, and shorten recovery times during black swan events. In positive markets, the strategy offers perpetual upside capture, with a participation rate of over 70% of an equity index. Over time, this convex payoff profile may be pivotal for building effective portfolios. While traditional buffered strategies will always have a role within the portfolio, when it comes to a long-term, core equity solution, the 10% managed floor is another holistic approach to risk management.
The Tech Bubble is 3/27/2000 to 10/7/2002. The Global Financial Crisis is from 10/09/2007 to 03/09/2009.
Put Options: an option for the holder to sell assets at an agreed price on or before a particular date.
Call Options: an option for the holder to buy assets at an agreed price on or before a particular date.
Out-of-the-Money Call Options: A call option where the underlying asset price is below the strike price of the call option.
Delta Call Options: Delta refers to the change in the options premium due to the change in the underlying asset price. 20-delta refers to an option that has a 20% chance of finishing in-the-money.
A Black Swan Event is often a market crash that exceeds six standard deviations, making it exceedingly rare from a probabilistic standpoint. The S&P 500 Low Volatility Index measures the performance of the 100 least volatile stocks in the S&P 500® based on their historical volatility. The S&P 500 Index tracks the performance of 500 of the largest companies listed on US stock exchanges. The Nasdaq-100 Index tracks the 100 largest companies by modified market capitalization trading on Nasdaq exchanges.
There is no guarantee the Fund will be successful in providing the sought-after protection of the floor. The Fund’s option strategy may cause the Fund to forego a portion of any upside returns of the Equity Portfolio.
The Fund seeks to provide risk-managed investment exposure to large-capitalization U.S. equity securities through its hedging strategy. There is no guarantee that the Fund will be successful in implementing its strategy to provide a hedge against overall market exposure. The fund seeks to achieve its investment objective by purchasing a series of four, one-year Flex Options packages with "laddered" expiration dates that are 3 months apart. The Fund will also systemically sell short-dated call option contracts, which have an expiration date of approximately two weeks, with an objective of generating incremental returns above and beyond the premium outlay of the protective put option contracts. The Fund does not provide principal protection or non-principal protection, and an investor may experience significant losses on its investment. In a market environment where the index is generally appreciating, the Fund may underperform the index and/or similarly situated funds.
The Sub-Adviser will seek to "ladder" the Fund’s option contracts by entering into new purchased put option contracts packages every three-months. After such put option contracts expire, the Fund will enter into new put option contracts with one-year expiration dates that are staggered every three months.
As a result of the Fund’s laddered investment approach, on an ongoing basis the Fund will experience investment floors that are expected to be greater or less than the 10% floor provided by an individual Options Portfolio.
The Fund seeks to provide capital appreciation while seeking to limit the amount of losses experienced by investors.
Because the Fund ladders its option contracts and the Fund’s put option contracts will have different terms (including expiration dates), different tranches of put option contracts may produce different returns, the effect of which may be to reduce the Fund’s sought-after protection. Therefore, at any given moment the Fund may not receive the benefit of the sought-after protection on losses that could be available from Options Portfolio with a single expiration date.
FLEX Options Risk. The Fund will utilize FLEX Options issued and guaranteed for settlement by the Options Clearing Corporation (OCC). In the unlikely event that the OCC becomes insolvent or is otherwise unable to meet its settlement obligations, the Fund could suffer significant losses. Additionally, FLEX Options may be less liquid than standard options. In a less liquid market for the FLEX Options, the Fund may have difficulty closing out certain FLEX Options positions at desired times and prices. The values of FLEX Options do not increase or decrease at the same rate as the reference asset and may vary due to factors other than the price of reference asset.