March 6, 2025
Tariff Turbulence
Tom O'Shea, CFA
Director of Investment Strategy
Innovator Capital Management
The animal spirits released after President Donald Trump's election victory have seemingly evaporated. Investor focus has shifted from pro-growth policies and deregulation to concerns over tariff implementation and government efficiency initiatives. Consequently, the gap created when U.S. equity markets reached record highs has closed as investors rotated toward smaller-cap stocks and international markets. We anticipate volatility will persist throughout 2025 as markets process the ongoing cycle of tariff declarations and retaliations. While some investors may be unsettled by this heightened volatility, it's worth examining the historical frequency of such market movements.
10% Corrections Typically Occur Every Year
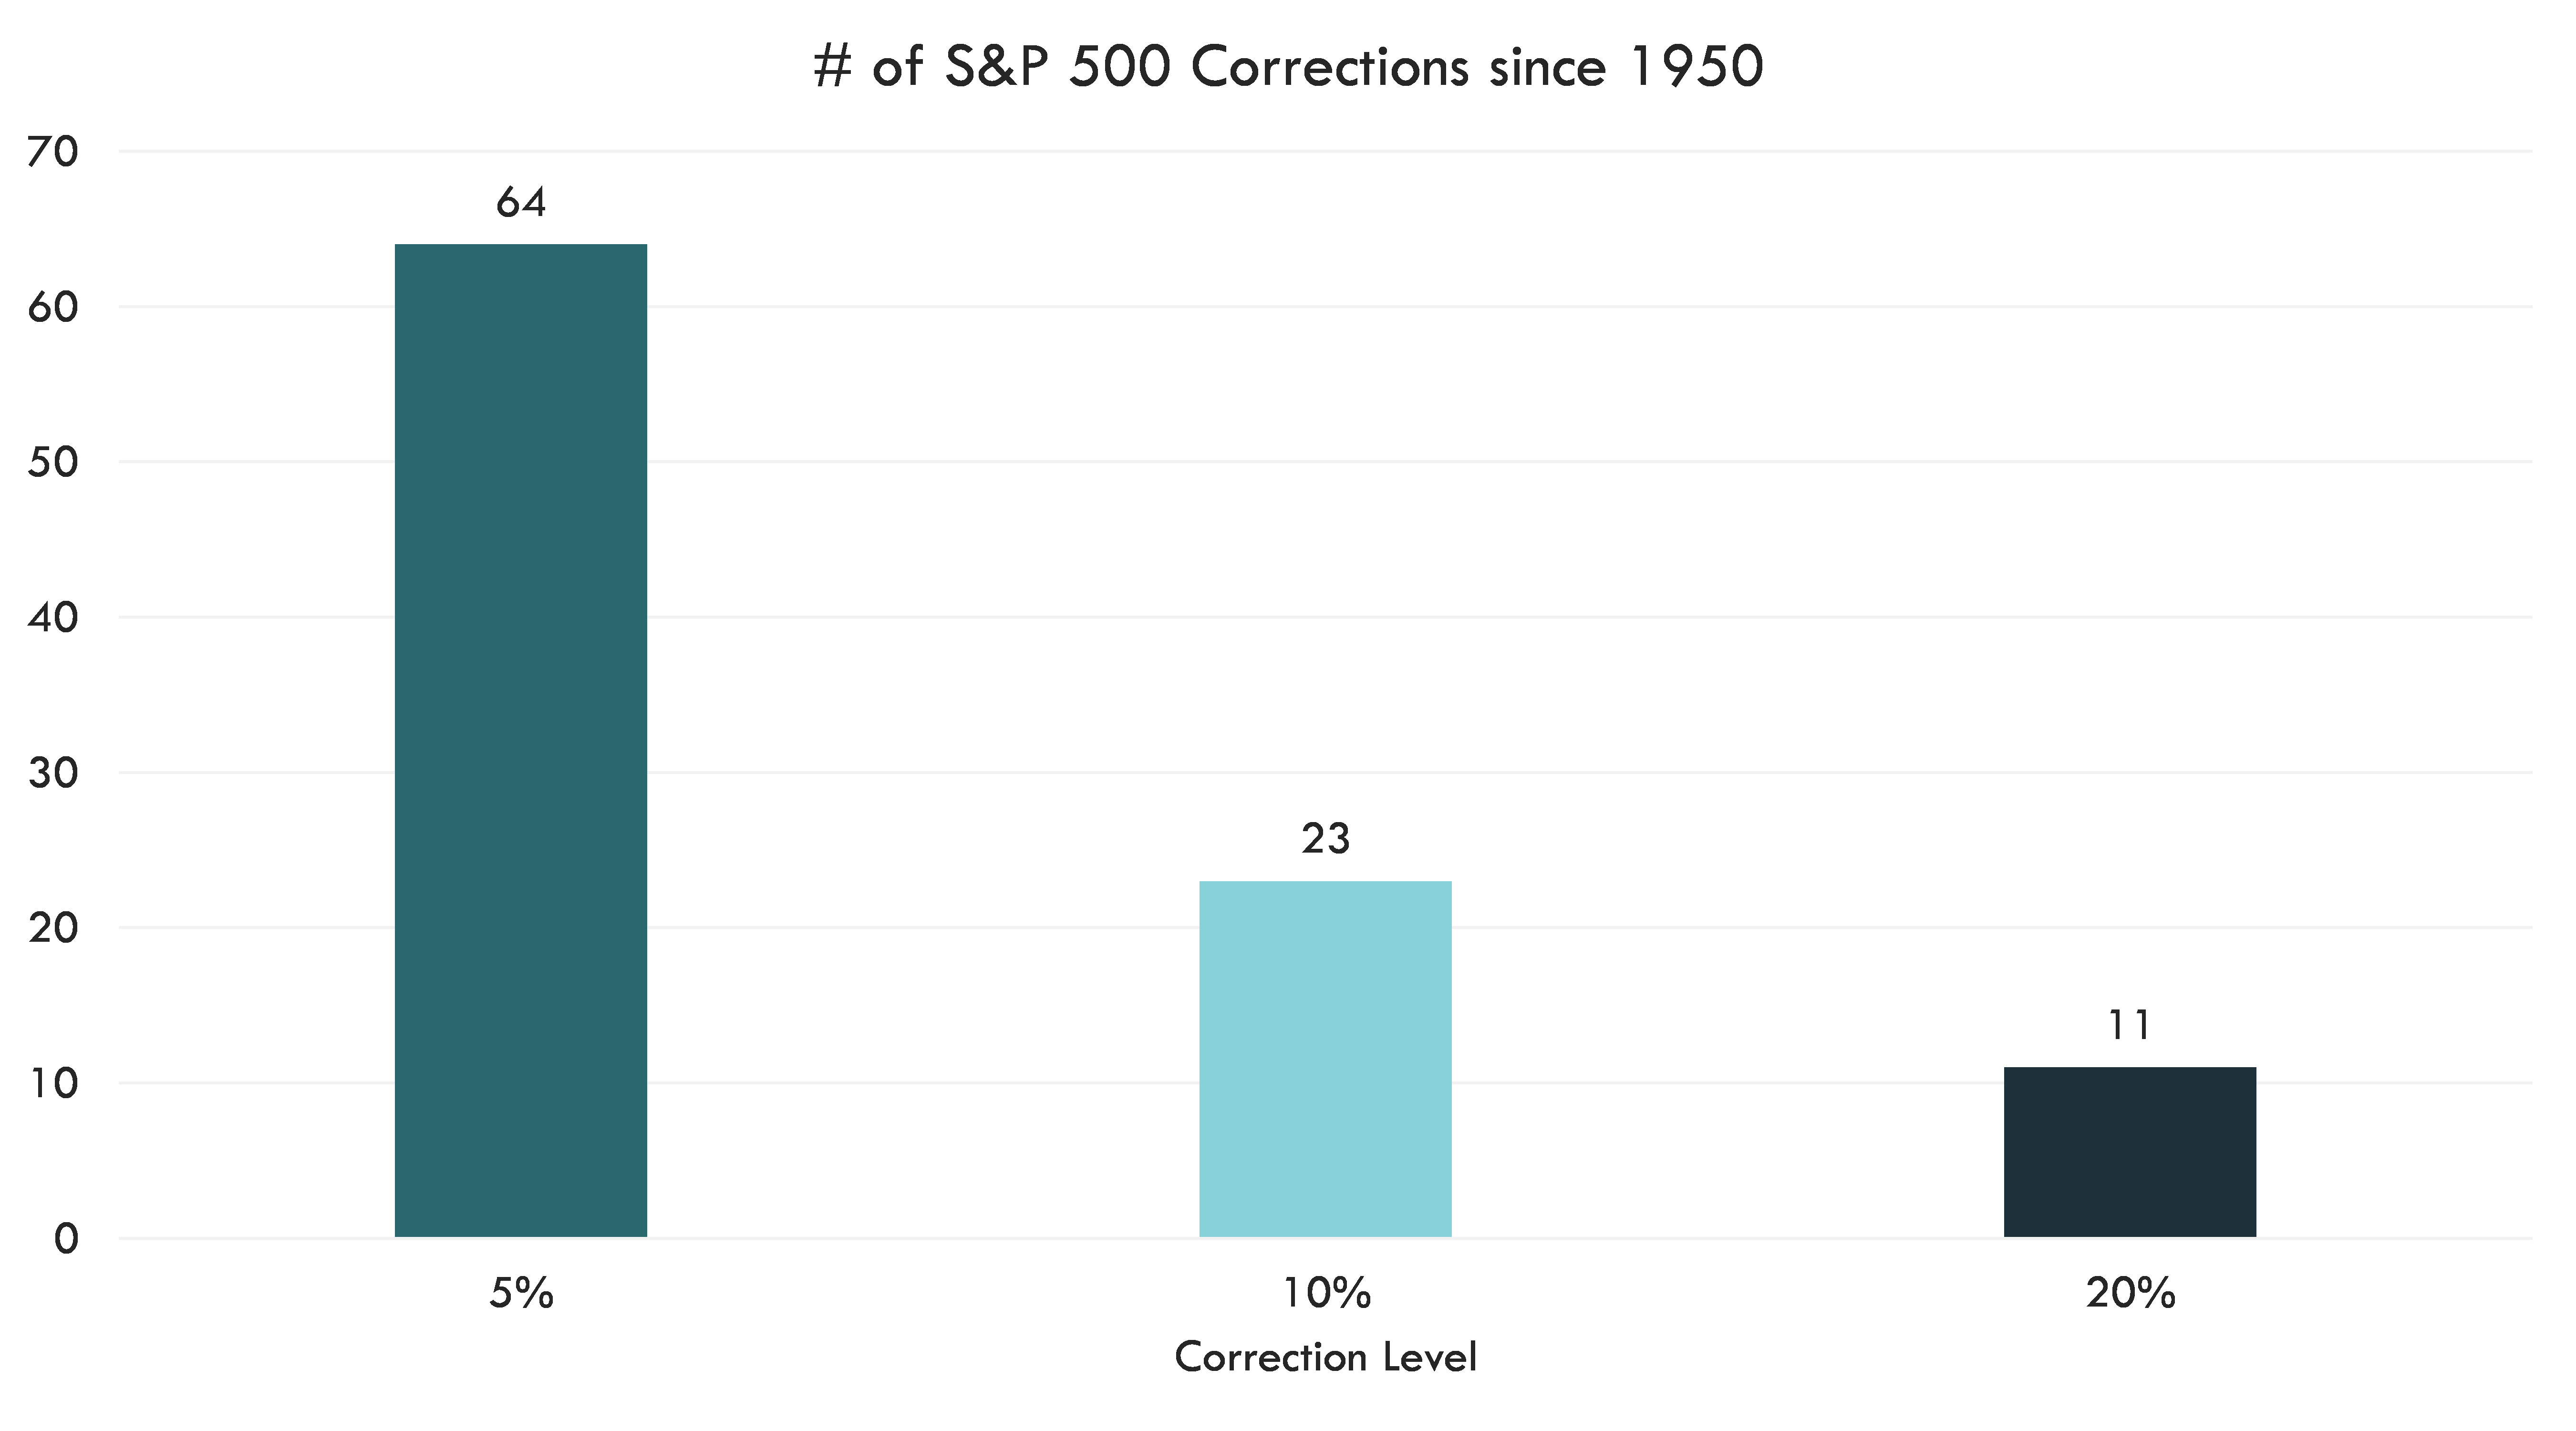
Source: Bloomberg, Innovator. Data from 12/31/1949 - 3/5/2025. We define a correction as a drawdown from a market peak to a percentage level, noted along the x-axis. A new correction cannot occur until the S&P 500 Index returns to previous peak levels. Past performance is not necessarily indicative of future results. One cannot invest directly in an index.
The U.S. equity market has declined approximately 5% from February's peak amid stagflation concerns. Investors' fears appear justified as the Atlanta Fed GDPNow forecast projects economic contraction of 2.8%. Additionally, nearly all key inflation indicators except core Personal Consumption Expenditure (PCE) have trended upward in recent months. Further economic deterioration could extend the current correction beyond its present level; however, from a historical perspective, this pullback was overdue. Since 1950, the S&P 500 has experienced 23 corrections of 10% or more. Typically, investors would experience 282 calendar days (median) between the recovery from a prior correction and the next market peak. At over 400 calendar days, we have exceeded this historical pattern significantly.
VIX Spikes Are Common
Investors encounter volatility cycles annually. The current environment bears similarities to recent market conditions. Realized annualized volatility remains relatively consistent with levels observed since 2019. The CBOE Volatility Index (VIX), which measures expected market volatility over the next 30 days, reached 23.5 in early March. The VIX climbed to similar levels when market participants adjusted to expectations of fewer interest rate cuts in 2025. Prior to the final Federal Reserve meeting of the year, we witnessed multiple election-related VIX spikes.
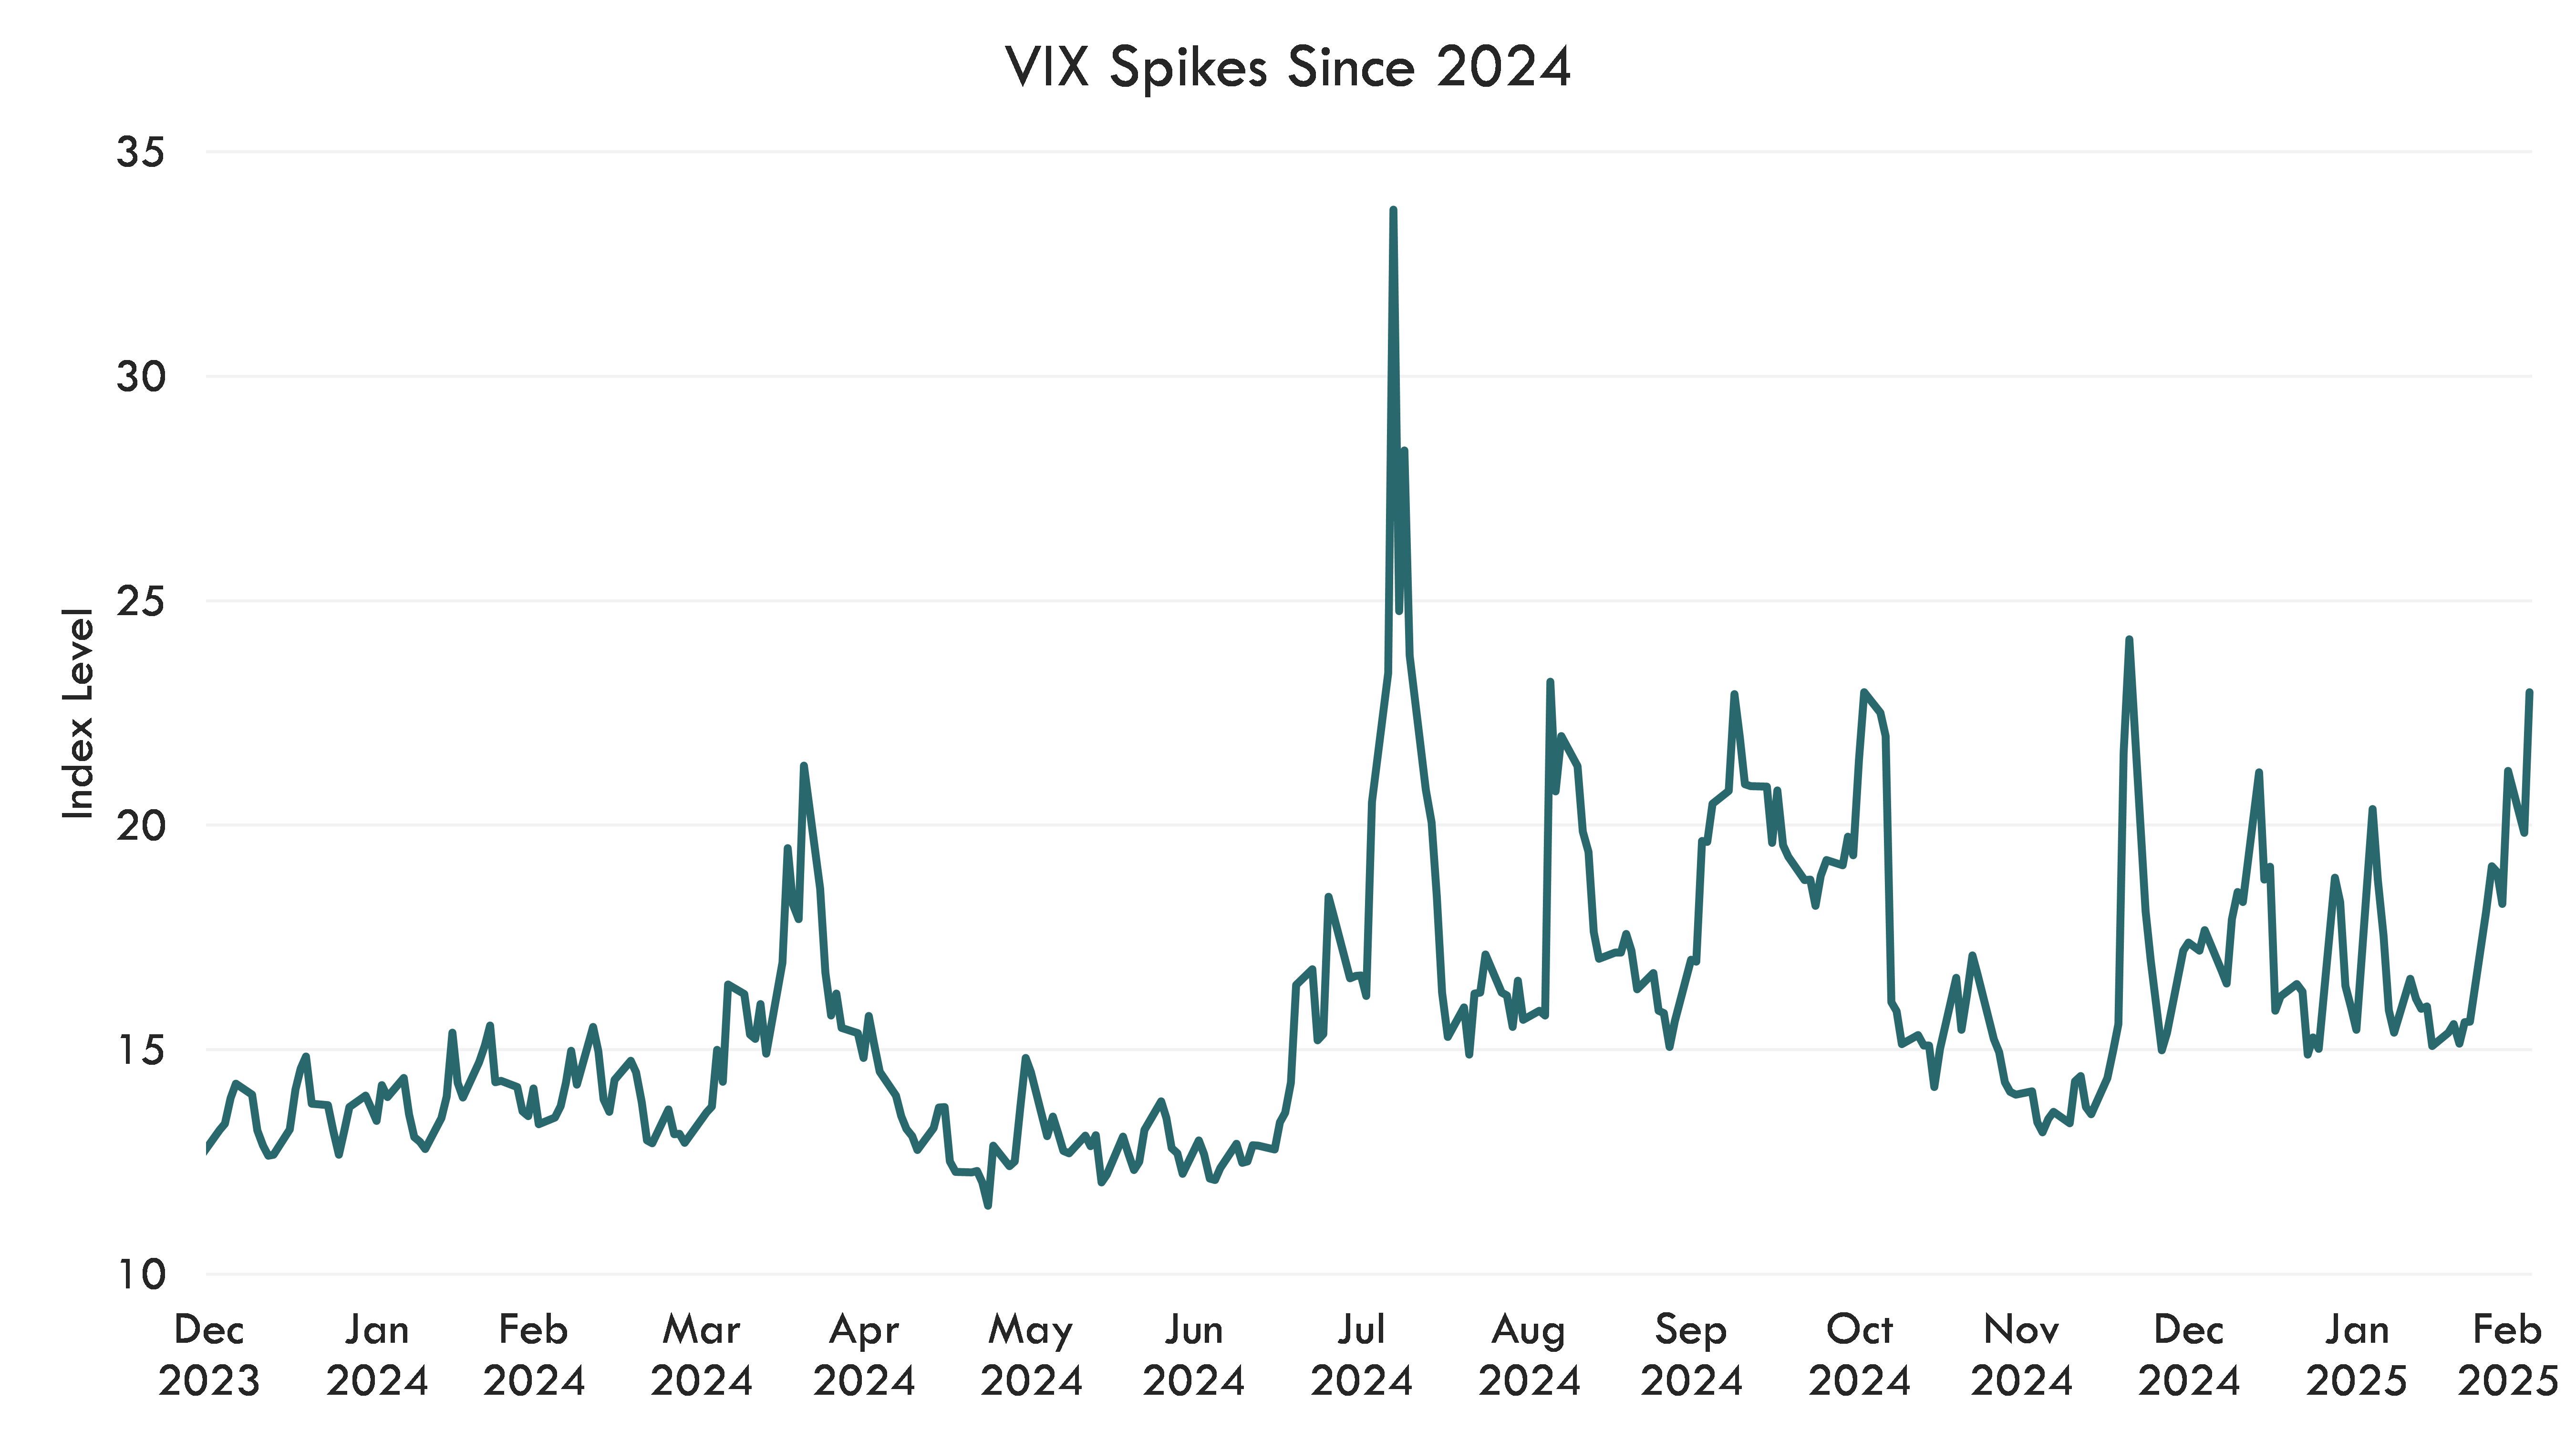
Source: Bloomberg, Innovator. Cboe Volatility Index level shown. Data from 12/31/2023 - 3/4/2025. Past performance is not necessarily indicative of future results. One cannot invest directly in an index.
In my view, the intra-day price swings of 2025 reveal a level of uncertainty not experienced since 2020 or 2022. During the COVID-19 pandemic, states adopted dramatically different approaches—some proceeded as if no pandemic existed while others immediately closed businesses. As the situation evolved, investors closely monitored case numbers and policy changes to forecast equity markets and adjusted allocations accordingly. Market participants experienced similar volatility during the 2022 bear market. As the Federal Reserve raised its main policy rate to combat inflation, futures markets consistently underestimated the probability of additional hikes. We expect President Trump's tariff policies to create a comparable push-and-pull environment to those seen in 2020 and 2022. Though only about two months into the year, intra-day price swings of 100 points or greater are becoming increasingly common. Through early March, median intra-day price fluctuations are the highest (excluding 2020 and 2022) since 2015. These dramatic movements reflect significant uncertainty surrounding the final tariff policy implementation and its implications for investors.
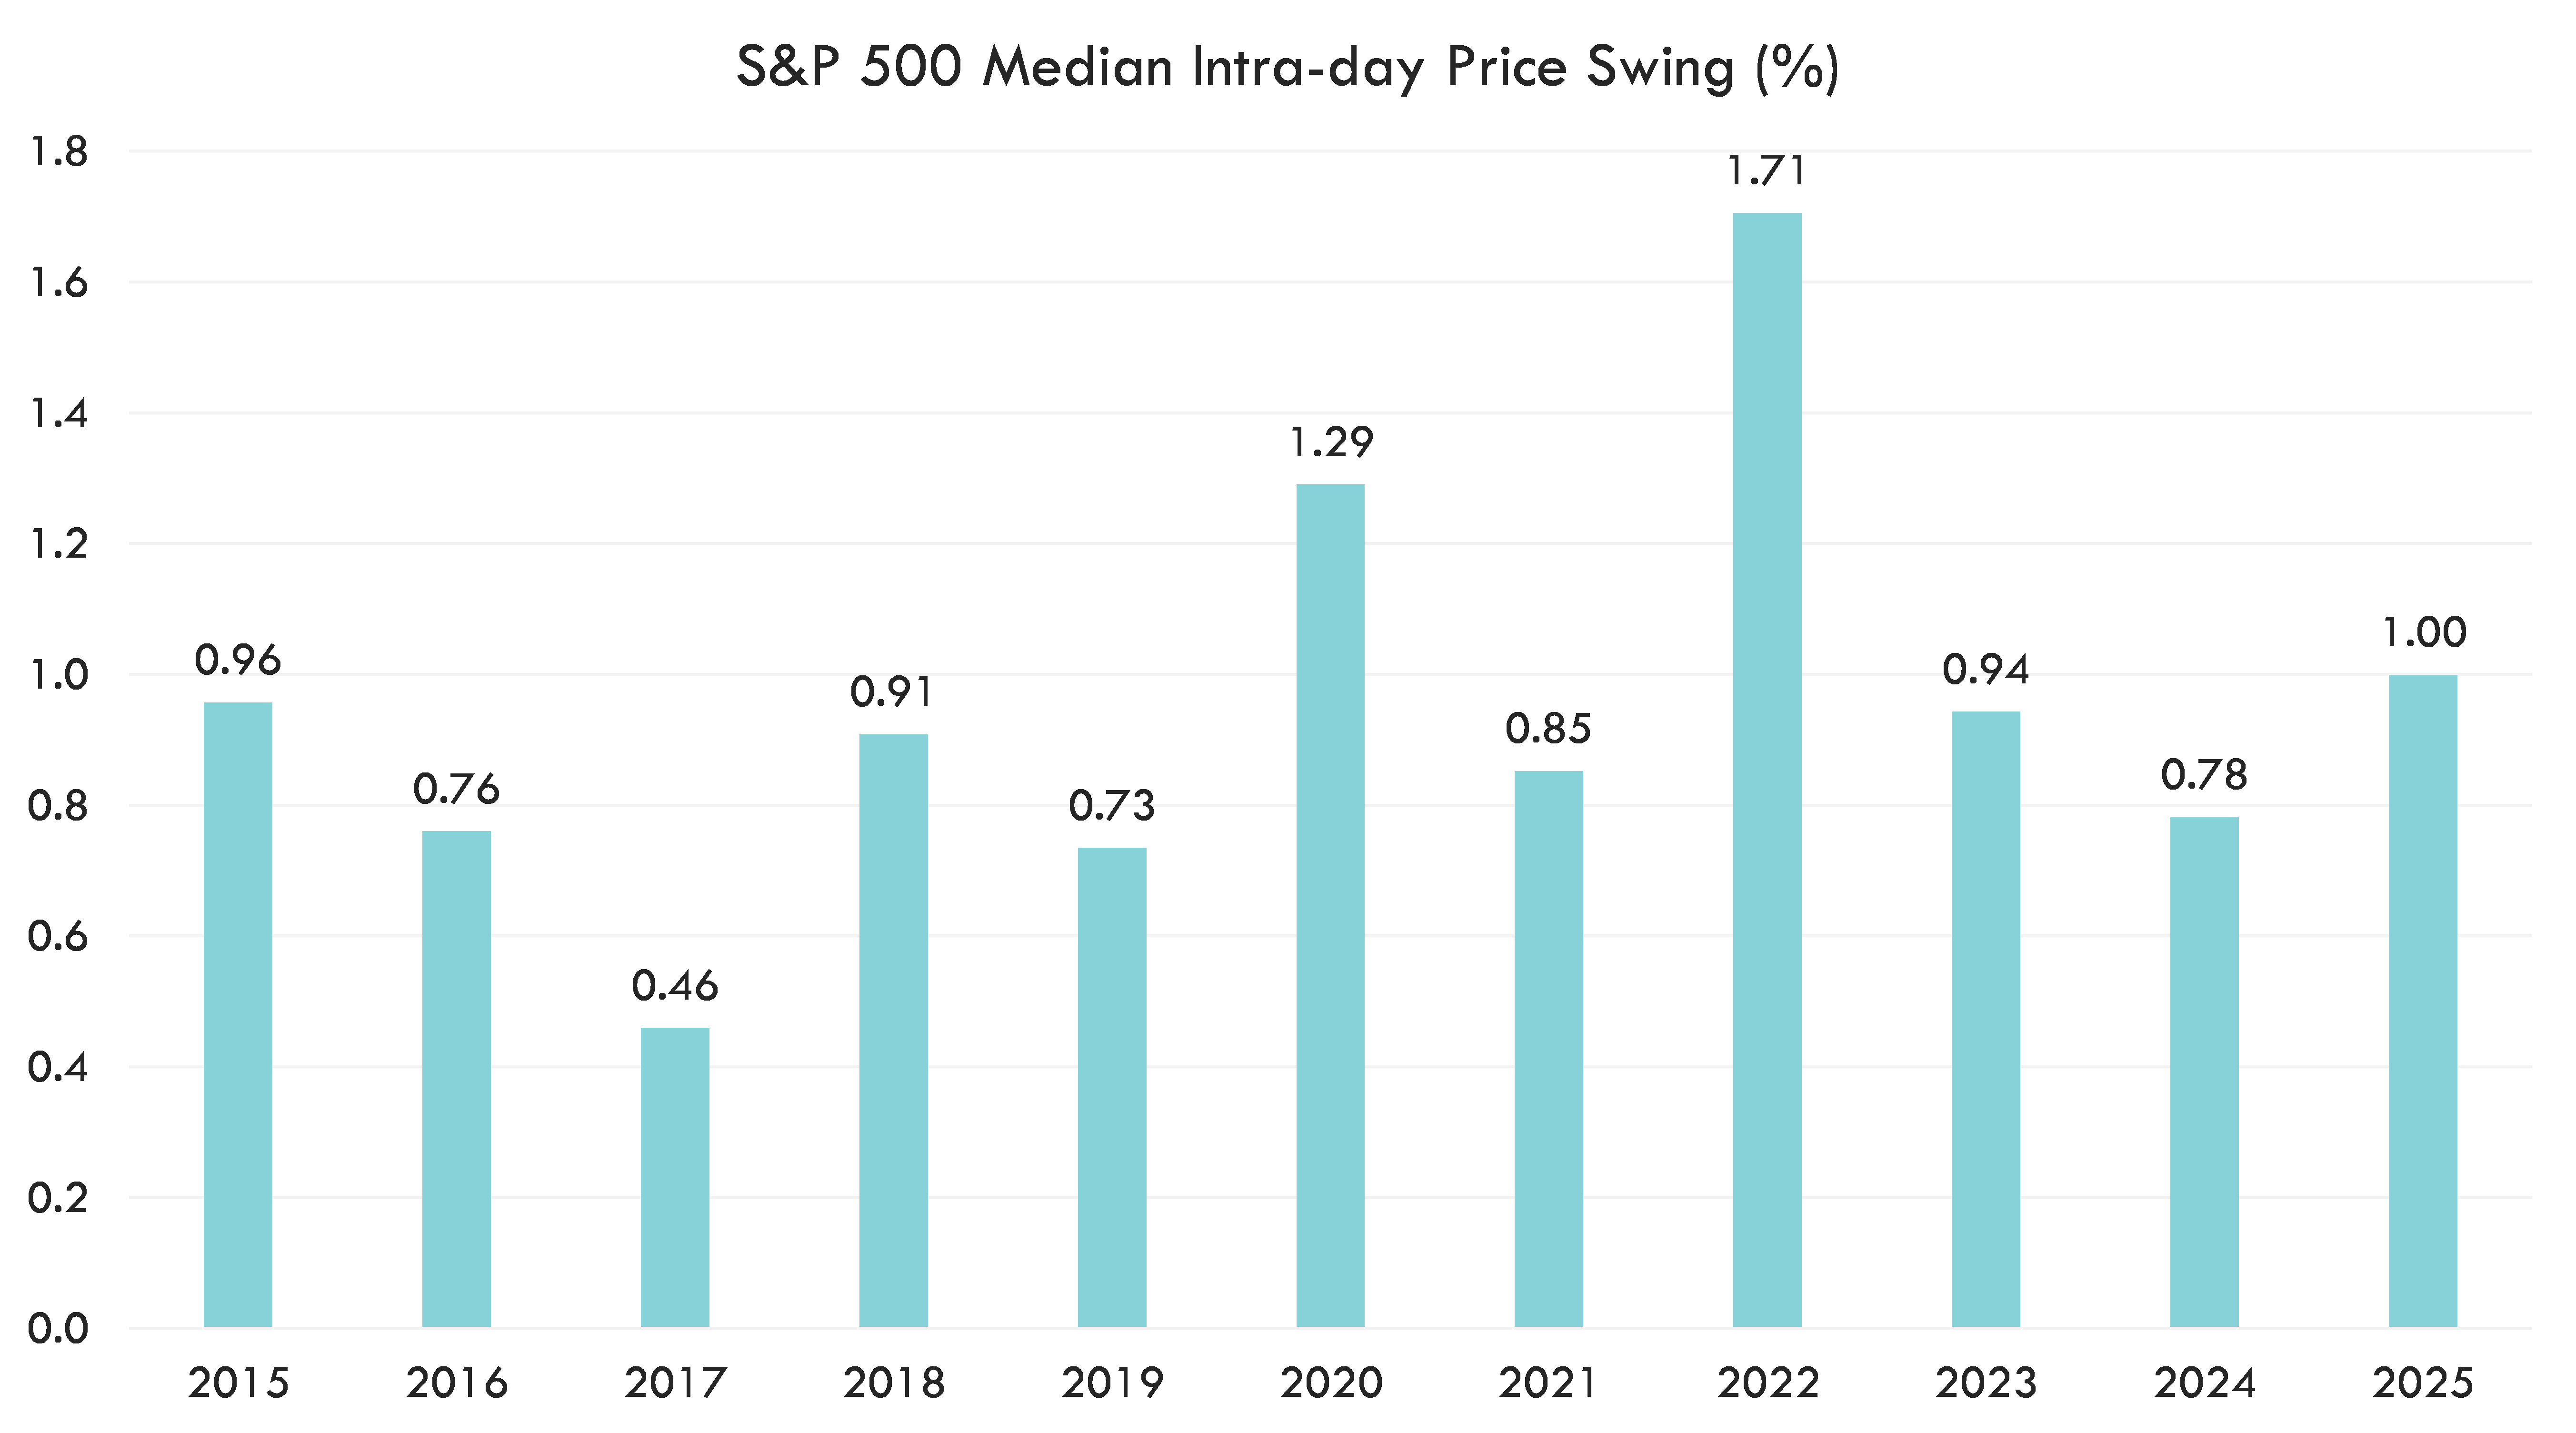
Source: Bloomberg, Innovator. S&P 500 Index evaluated. Data from 12/31/2014 - 3/4/2025. Past performance is not necessarily indicative of future results. One cannot invest directly in an index.
Conclusion
Elevated volatility does not necessarily translate to poor equity market performance. As the Q4 earnings season concludes, S&P 500 companies have delivered solid revenue and earnings growth of 5.3% and 13.2%, respectively. To sustain this earnings momentum, corporate executives must strategically navigate President Trump's evolving tariff policies. Companies face critical decisions about whether market conditions will support passing higher input costs to consumers or absorbing these expenses internally to preserve demand. Short-term trading strategies amid such uncertainty may lead to a whipsaw in portfolio values. Geographic diversification and broad asset class allocation may prove effective in mitigating risks in an environment characterized by sticky inflation and decelerating economic growth.
This material contains the current research and opinions of its author, which are subject to change without notice. This material is not a recommendation to participate in any particular trading strategy and does not constitute an offer or solicitation to purchase any investment product. Unless expressly stated to the contrary, the opinions, interpretations, and findings herein do not necessarily represent the views of Innovator Capital Management, LLC (“Innovator”) or any of its affiliates.
This material is provided for informational purposes only. References to specific securities in this material are provided for informational purposes only and do not constitute a recommendation for any security. Readers should consult with their investment and tax advisers to obtain investment advice and should not rely upon information published by Innovator or any of its affiliates. Past performance does not guarantee future results. The information herein represents an evaluation of market conditions as of the date of publishing, is subject to change, and is not intended to be a forecast of investment outcomes.
This material is provided for informational purposes only and is made available on an “as is” basis, without representation or warranty. The information herein is only current as of the date indicated and may be superseded by subsequent market events or for other reasons. This material represents an evaluation of market conditions as of the date of publishing, is subject to change without notice, and is not intended to be a forecast of investment outcomes. Innovator specifically disclaims all warranties, express or implied, to the full extent permitted by applicable law, regarding the accuracy, completeness, or usefulness of this information, including any forecasts or price targets contained herein, and assumes no liability with respect to the consequences of relying on this information for investment or other purposes.
Certain information herein contains forward-looking statements such as "will," "may," "should," "expect," "target," "anticipate," or other variations of these statements. Forward-looking statements are based upon assumptions which may not occur, while other conditions not taken into account may occur. Actual events or results may differ materially from those contemplated in such forward-looking statements.